Can Labour-run councils take credit for building social housing?
"If you look around the country, in which areas are more social housing being built now, the answer is in Labour controlled local authorities."
Hilary Benn, BBC Sunday Politics
This article was updated on 24 April 2013
With local elections just around the corner, Labour's Shadow Communities and Local Government Secretary Hilary Benn took to the airwaves to trumpet Labour councils' record when it comes to social housing provision. But does his claim stack up?
The source: A Labour FOI
We contacted Hilary Benn's office to ask after the source for the claim and were told the evidence comes from a Freedom of Information (FOI) request his office sent out to 324 councils earlier this year, of which 246 (76%) replied.
Through the FOI, the party concluded that "of the 12,285 social homes with planning permission and funding in place, 7,275 are being built in Labour councils (59%)."
Labour's data focuses on the number of social housing places due to be built between 2012/13 and 2014/15, broken down by the political control of the council involved. According to the party "Labour authorities are building on average five times (100 homes in three years) what Tory authorities are building (20 homes), and nearly twice as many as Liberals (54 homes)."

When the findings were published, Hilary Benn said this was proof that social housing was Labour's priority. But can this growth really be explained just through Labour party policies?
What the data tells us
The first thing to say is that the outcome of Labour's FOI seems to show a response bias in the 246 responses it received. Almost all Labour controlled-councils (91%) replied, compared to 71% of all Conservative-controlled councils, and 77% of Liberal Democrat run councils.
This may have skewed the outcome, but we can't comment on this nor on its accurancy because we haven't had access to the FOI responses, given that the party declined to make the data available. However there is data in the public domain that can help us put these claims into perspective.
We got hold of English Housing Survey figures n the additional social rented homes by local authority for 2011/12 published by the Department for Communities and Local Government (DCLG), and matched it to the political control of each council.
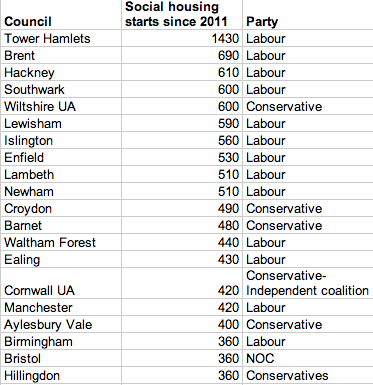
As we can see from the table below, looking at the 20 councils which saw the biggest increases in their social housing starts in 2011/12, most were Labour controlled (13 out of 20).

While this might, on the face of it, add weight to Mr Benn's claim, there are also other factors that could be at play here.
For example, 13 of the councils in the list are London boroughs (among them Tower Hamlets, Southwark, Hackney, Islington, and Lewisham), and the list also includes other big cities like Manchester and Birmingham.
We might also conclude from this therefore that the it was demographic pressures in urban areas that were driving the increase in social housing starts in these areas, rather than council politics. Of course, Labour councils also tend to be concentrated in urban areas.
A different angle
To get a different perspective on this data, we could therefore look at the proportional growth in social housing since the 2010 elections (i.e. taking account of the higher concentration of social housing in cities). We couldn't go back any further because local government was subject to a series of structural changes in 2009, so we wouldn't be comparing like with like.
Which councils saw the greatest rate of growth?
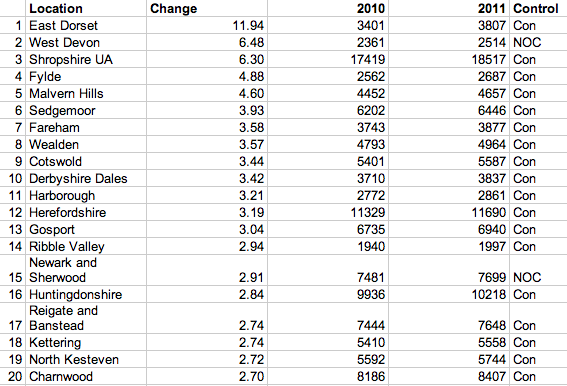
Using data published by the DCLG we can look at proportional growth, rather than growth in raw numbers. Almost all councils which have overseen the greatest rate of change are controlled by the Conservative Party. If we look at the top 20, 18 are Conservative-controlled councils, while the remaining two are NOCs.

Furthermore, the average proportional increase across all Conservative controlled councils has been greater than it has in Labour councils.
Since 2010 Labour councils increased their housing stock by 0.03%, whereas Conservative Councils& increased their supply by 0.47%. However both lag behind the Lib Dems, who increased the social housing stock by the most (0.63%). NOC (no overall controll) councils decreased their stock by 0.4%.
Conclusion
Hilary Benn's claim rests upon the number of social housing places due to be added to local authority stocks by 2015, although unfortunately, his team have decided not to publish the Freedom of Information data they've analysed to reach this conclusion, meaning that we can't gauge its accuracy.
However as we've seen, even if the numbers provided by Mr Benn check out, it doesn't necessarily mean that Labour are more committed to providing social housing than Conservative councils. Looking at social housing starts and political control, we can see that there is undoubtedly a correlation between Labour control and strong social housing building. However there is also a strong correlation between social housing construction and urban councils, which also tend to be Labour controlled. It may therefore be demographic pressures rather than political ones driving this trend.
In fact, if we look at the proportional growth in social housing stocks rather than growth in raw numbers (to control for the fact that stocks tend also to be higher in urban areas), we see a quite different picture, where there is a strong correlation between Conservative control and strong growth. 17 of the top 20 councils that grew their social housing stock the most proportionally were Conservative, while the average growth was also higher in Conservative areas than it was in Labour ones.
So while Mr Benn might not be wrong in terms of planned social housing projects - although even here we'd more information to properly assess it - we can also draw very different conclusions if we change our perspective slightly.
Update (24/04/2013)
We have updated the piece in response to some feedback.
- We added a note on the response bias of Labour's FOI request.
- We'd also like to point out that the social housing stock data has one missing data point for 2010, and six for 2011 out of 324. Whilst this shouldn't substantially alter our conclusions, readers should take it into account when judging Labour's claims.
---
Flickr image courtesy of Peter Guthrie