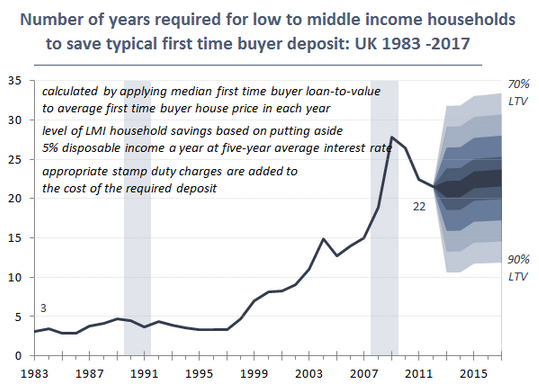
Does it take an average family 22 years to save for a home deposit?
"it now takes an average family 22 years to save for a deposit on a home - compared with three years in 1997 when Labour last took power."
Ed Miliband on BBC News, 24 September 2013
Ahead of his leader's speech at conference today, Ed Miliband was already setting out Labour's stall for the next parliament - promising plans for 200,000 homes a year by 2020, compared to the 121,000 built last year.
He brought his case closer to home by claiming it now takes an average family 22 years to save for a deposit. A similar family could have expected to wait just three years in 1997, according to the Labour leader.
Squeezed Britain
That's the title of a project by the Resolution Foundation (RES) - the source of this claim. The most recent report in this series was produced earlier this year and does an excellent job of providing detailed figures behind its claims along with descriptions of its methods. At its point of origin, the claim itself is actually a little different:
"22 years [2012]: Number of years required for low to middle income households to save for typical first time buyer deposit"
So we're not necessarily dealing with the 'average' household here, just (as the RES define it in Chapter 7 of the report) working age households with low to middle incomes. 'Low to middle' incomes are those which fall in the poorest half of all households when ordered by income before tax (excluding the poorest 10% and those most heavily reliant on income-based benefits).
Taking these households, RES assumed that they save 5% of their income each year to put towards a deposit - for the purposes of this example at least. Then taking average house prices from the Halifax house price index and deposit levels relative to this from the Council of Mortgage Lenders, it calculated how long it would take these hypothetical households to save for a deposit.
The answer: 22 years in 2012. RES's figures actually show this is down from 28 years in 2008, but it is historically very high. It was 3 years in 1997 and the same as far back as 1983.

An example, not necessarily a reality
Unfortunately, most readers who saw this claim earlier today won't have had easy access to the methodology behind how it was calculated. And there's good reason to think people would get the wrong end of the stick simply taking Mr Miliband's claim at face-value.
For a start, the data isn't based on what's actually happening, but on a hypothetical situation in which a low to middle income family would want to put aside 5% of their income for a deposit on a house.
This is assuming of course that a family would put aside 5%. RES emphasised this was more indicative than precise, roughly at the rate at which the average household would be expected to save anyway (so could even be a generous figure for a lower-income household). Still, given it's a hypothetical household, we know even less about what it might expect to put aside towards a hypothetical deposit.
Taken this far alone, it's a useful but uncertain indicator of what barriers face this kind of family in owning their own home.
But take it further, and the figures change. For instance, a low to middle income household in this case would be earning a gross income of roughly £20-25,000 a year. But people who actually become first-time buyers are a different demographic. They can be expected to have an average income of more like £36,000.
RES have helpfully provided an additional calculation - if we just look at average first-time buyers like this then they might be expected to spend 13 years saving rather than 22 (assuming of course they do this off their own back without the help of family and friends).
So it depends on which way you look at it. The reality is likely to be less bleak for the average first-time buyer than the figures mentioned today, but the numbers do give some indication of the wait that might face a lower income household if they were to save up for a deposit. In either case, the assumptions behind the figures need to be kept explicit.