Four factchecks from the Budget
The Chancellor has delivered his final Budget of this parliament, the details of which will be pored over in the days to come. Even before that, George Osborne and Ed Miliband have clashed on what's been happening to living standards, taxes and spending.
We've taken a look at several claims from both sides.
Living standards: up or down?
"Today the latest projections show that living standards will be higher than they were when we came to office."—George Osborne
"On living standards, which the Chancellor made much of in his speech, he knows that, as the official measure from the Office for National Statistics shows, people are clearly worse off under him"—Ed Miliband
The Chancellor announced that households are £900 better off in 2015 than they were in 2010. Meanwhile Ed Miliband said that people are £1,127 worse off, and that wages are down £1,600.
So what's actually happening here?
The Chancellor's using a measure called Real Disposable Household Income per capita. Disposable income is often described as 'take-home' pay, and this measure takes into account people's incomes (including some taxes and benefits) and the prices of goods and services. The government describes it as "the most comprehensive measure of living standards".
It fell at the start of the parliament and has since changed very little. However the Office for Budget Responsibility forecasts it will rise in 2015 to be higher than the level in 2010, likely due to low inflation and rising income from employment—but there's some way to go yet before the actual figures can be established.
Ed Miliband uses one number for changes to wages (£1,600 a year worse off) and another for changes to taxes and benefits (£1,127 a year worse off).
The £1,600 a year claim is the change in the median wage (before tax) in real terms. It's not a complete measure of living standards because it doesn't take into account the effects of tax or benefit changes, so to this extent it's not entirely right to say people are "worse off" overall by this amount.
It also doesn't tell us everything about the wages of people who've been in continuous employment. For people in the same full-time job over time, growth in earnings has consistently outstripped inflation.
The Leader of the Opposition also offers a second figure: that households are £1,127 a year worse off on average as a result of taxes and benefit changes (compared to a scenario without policy changes). This is based on analysis by the Institute for Fiscal Studies (IFS).
The IFS separately warns against interpreting too much about governments' records based on the exact times in office:
"The coalition government took office after the Great Recession, just as household incomes were beginning their subsequent and inevitable decline. It would be misleading to attribute all trends in living standards that occurred before May 2010 to Labour and all trends thereafter to the coalition."
Fastest growing economy
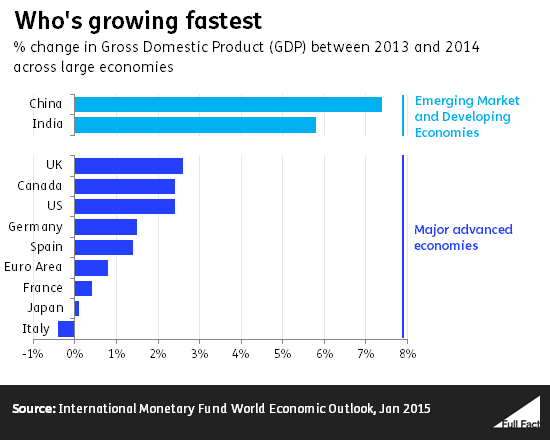
"Today I can confirm that in the last year we have grown faster than any other major advanced economy in the world"—George Osborne
It's a familiar claim and it's based on figures compiled by the International Monetary Fund. UK gross domestic product (GDP) was 2.6% higher in 2014 than it was in 2013. That's higher than any 'major advanced economy' picked out by the IMF's definition, which is the G7 major economies. The UK also grew faster than Spain.
The Chancellor was careful to specify this is among advanced economies, as the case for other large economies such as India and China is much different. Their growth consistently outstrips those of 'advanced' economies but they're not generally considered comparable to the likes of the UK and Germany.
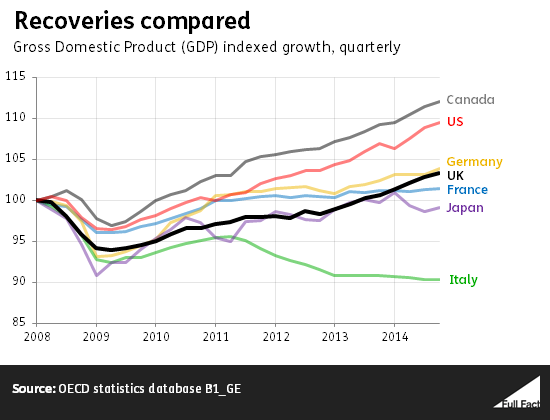
The UK's recent growth also comes after a period of slow recovery compared to other large nations, and we're still behind several compared to the pre-recession peak.
Many zero hours contracts
"... there are more zero-hours contracts than the populations of Glasgow, Leeds and Cardiff combined."—Ed Miliband
This claim is a bit odd as it compares contracts to people. When it comes to zero-hours contracts, there's a big difference between the two.
Halfway through 2013, the estimated population of these three cities was about 1.7 million people. This is the most recent set of population estimates available.
The number of zero hours contracts is a bit trickier to estimate. The ONS counts the number of contracts with no guaranteed minimum hours.
There were 1.8 million contracts that met this description (and provided work) in a two week period in August 2014. This is an estimate from a sample, so there's some margin for error on the actual figure.
The number of people on zero hour contracts is much lower; there were 697,000 people employed on a zero hour contract as their main job in October-December 2014.
Child poverty down
"Compared with five years ago ... child poverty is down"—George Osborne
This is correct by some measures, but not by others.
We have child poverty data up to 2012/13. Compared to 2009/10 (which ends just before the election), there are 300,000 fewer children in relative low income (as in, below 60% of the median household income), without taking housing costs into account.
At the same time, there are 200,000 more children in absolute low income (measured against a fixed standard rather than current incomes) on the same measure. If we look at the proportion of children in low income households, then the story is much the same.
The IFS has projected poverty rates and levels to 2014-15, which show similar if not slightly higher levels and rates than 2012/13, but maintaining the broad trend since 2009/10.
The Prime Minister has previously criticised the use of relative low income to measure poverty. It's true that this measure can sometimes produce odd results, for instance if most people's incomes fall during an economic downturn, this could have the effect of lifting people out of 'relative' low income.

