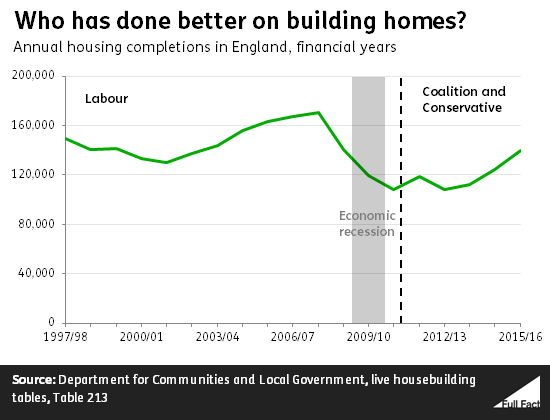
House building: higher or lower depending on the date
“I’m pleased that house building has been up under a Conservative Government, compared to a Labour Government.”
Theresa May, 7 September 2016
“Actually, Mr Speaker, house building under this Government is 45,000 a year less than it was under the last Labour Government.”
Jeremy Corbyn, 7 September 2016
There are a lot of different ways of looking at house building figures over time. Change the dates you’re looking at, and you can easily find support for each of the leaders’ claims above.
Another difficulty is deciding how to separate different governments’ records. Houses built early on under one government will have been started under the previous one, and it can take time before a new housing policy is introduced and has an impact on completions locally.
With that caveat, a straightforward way to look at it is to take the average number of houses built in England under the whole of the last Labour government compared to the governments since. It makes sense to single out England as housing policy is run by devolved governments in Scotland, Wales and Northern Ireland.
Around 150,000 houses a year were built under Labour Prime Ministers between 1997 and 2010, compared to 120,000 under Conservative ones since 2010.

Labour told us that it was looking instead at homes completed across the UK, per calendar year. On average 190,000 a year were built between 1997 and 2010, compared to 145,000 between 2010 and 2015.
That’s where Mr Corbyn’s 45,000 claim comes from.
By contrast, when Labour left office, housing completions were running at around 120,000 a year, whereas it’s more like 140,000 now. House building fell sharply during the 2008/09 recession.
That may explain Ms May’s statement. We’ve asked the government for a source.
No recent administration has seen enough homes built to keep up with demand.