On Wednesday, Conservative and Labour MPs both presented official statistics to criticise the other side’s record on tackling poverty. In the process, they both proved why our current statistics can be cherry-picked to obscure what is really happening with poverty in the UK.
What’s the problem?
There are so many different ways to measure changes in poverty that it is often easy to find one to support almost any argument you want to make.
What we know about poverty is also subject to delay. So when, last week, Dr Kieran Mullan MP and Kate Green MP talked about the poverty rates “today”, they were actually using data from 2018/19, which is the most recent available. This could be very important, if poverty rates have changed significantly since 2018/19, given the large economic impact of the coronavirus pandemic.
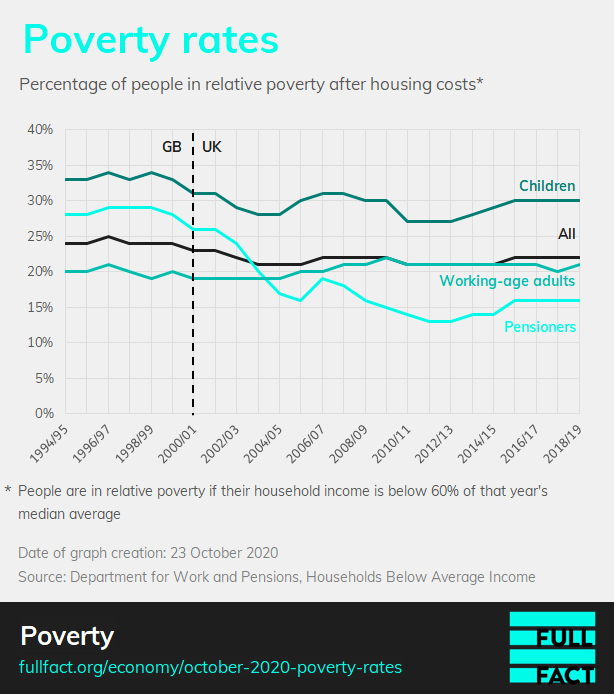
And this is before we look closely at the details. Both Dr Mullan and Ms Green talked about relative poverty. This is only one of the measures available (we’ll talk about the others later). If we look at the overall rate of relative poverty since the mid-1990s—the black line—it shows little change in recent years, after a slight fall around the turn of the century.
The relative poverty rate among children has been slightly more volatile, and the fall among pensioners in the first decade of the century was very pronounced. Each MP chose a different piece of this data, with which to prove their point.
Dr Mullan’s claim
Dr Mullan claimed that the number of people in relative poverty is around 14 million “now”, and that this is the same as it was in 2000, when Labour was in power.
By the government’s measure, someone is in relative low income if their household income is below 60% of the national median average that year. This can be calculated both before and after housing costs.
The number of people in relative low income after housing costs in 2000/01 was 13 million (23% of the population). In the latest figures for 2018/19 it is 14.5 million (22% of the population). These are not quite comparable, as the 2000/01 figure is just for Great Britain, while the 2018/19 figure is for the whole of the UK.
Given that Dr Mullan seems to have been commenting on the progress (or lack thereof) made by the past Labour administration on this issue, it seems odd to compare one set of figures after three years of Labour government with another after eight years of Conservative-led government.
The population was also growing during this period, which is why it also makes more sense to look at the proportion of the population in relative poverty, not just the raw number.
In 1996/97, the year before Labour came to office, the number of people in relative low income in Great Britain was 14 million, or 25% of the population. In their final year in office (2009/10) there were 13.6 million people in relative low income in the UK, or 22% of the population. However, this is only one way of looking at the figures.
Ms Green’s claim
Ms Green’s figures are largely accurate.
In 2010/11 there were 3.6 million children (not 3.5 million) in relative poverty after housing costs. In 2018/19 this was, as claimed, 4.2 million.
However, while Ms Green did not say so explicitly, the choice of 2010/11 seems to suggest she was responding to Dr Mullan’s assessment of Labour’s record with assessment of the Conservative-led governments, which began in 2010.
If so, the exact choice of year is important. As you can see on the graph above, relative child poverty fell sharply between 2009/10 and 2010/11. The Conservative-led coalition government took power in May 2010, meaning the party was in government for almost the whole of the 2010/11 financial year.
If you assess its record from that year, the party does not get credit for a fall in poverty that happened almost entirely when it was in power. If you assess it from the year before, it looks like the Coalition government was responsible for an immediate and dramatic improvement in relative child poverty in its first year.
This also sets the baseline for the next 10 years. Choose 2009/10 as the starting point and child relative poverty has not changed under the Conservatives. Choose 2010/11, and it has got worse.
Ultimately this shows that it is simplistic to assess any government’s record on something like poverty without looking at all the measurements in context.
Measure for measure
We’ve already talked about how relative poverty can be taken before housing costs or after housing costs, and how it can be expressed as an absolute number of people or a percentage of the population. Not to mention the many different periods and groups of people you could choose to look at.
And even that is not all the ways in which you could spin different narratives about poverty rates in the UK.
There is also absolute poverty, a different measure, which looks at the number of people in households where the income is below 60% of the average median level in 2010/11, adjusted for inflation. This sometimes tells a different story.
Then there is the Social Metrics Commission (SMC), an independent panel, which has created a new measure of relative poverty—which also shows that the poverty rate over the past two decades has remained fairly flat among children and working-age adults but fallen for pensioners.
And the Department for Work and Pensions has said that after reflecting on the work of the SMC, it too is due to publish another set of experimental poverty statistics alongside its usual data release later this year, giving MPs of all stripes yet another poverty dataset with which to debate.
