Is poverty rising or falling?
Yesterday's papers featured seemingly conflicting trends from the latest official statistics measuring income poverty. The Daily Mail reported poverty levels have fallen to the lowest level since the 1980s, while the Mirror reported that child poverty is rising under the current government.
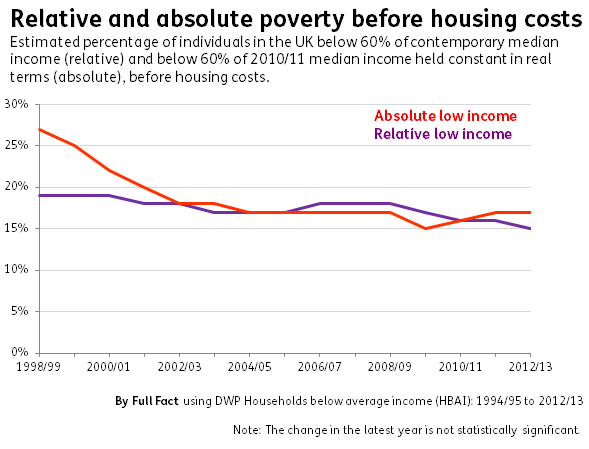
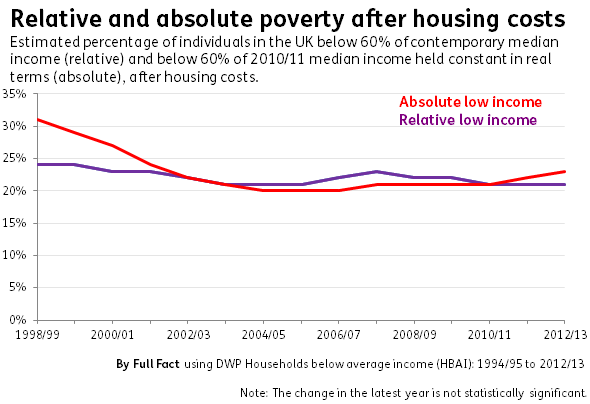
The picture is different depending on which measure you look at. Relative to the average income, the percentage of people considered to be in poverty has fallen or remained stable over the last few years. But, against a set level of income (referred to as the 'absolute' measure), the proportion classed as in poverty has increased since 2009/10.
Because the estimates are based on survey data, relatively small changes in the findings don't necessarily reflect actual changes in poverty levels, because the estimates are uncertain. Most changes in the last year aren't considered significant enough to tell what the trend is, so the longer-term picture can be more useful to look at.
Income also isn't the only way to measure poverty. Other studies measuring poverty on the basis of affordability of items deemed a necessity by the general public have found the number of households unable to afford one or more essential household good has roughly doubled since 1990.
Relative poverty is decreasing while absolute poverty is increasing
The data reflects the claims in the Mail and the BBC that the number of people in relative poverty fell by 100,000 people last year to 9.7 million, without factoring housing costs in - but the change is too small to say this with certainty. But it is part of a longer-term tend of falls or periods of stability over the last few years. The percentage of individuals in relative poverty is now at its lowest recorded level since the 1980s.
The long-term picture isn't significantly different when you take housing costs into account.
The change is more notable when looking at working-age adults, who've seen small steady increases in absolute poverty after housing costs since 2004/05, now at 23% or 8.7 million people. In 2004/05 it was 18% or 6.4 million. One reason for this is that average income after housing costs has continued to fall since 2009/10, partly because of rising housing costs in the social rented sector.
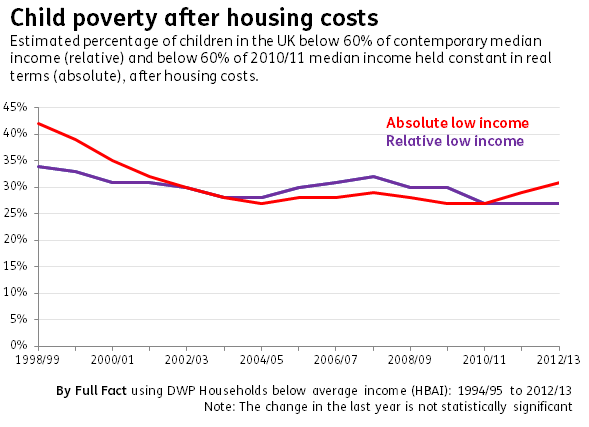
Child poverty has fluctuated since 2004/05 but overall levels remain broadly stable
Levels of child poverty can be dependent on family type, with children in single parent families more likely to be living in relative poverty (before housing costs) than those in couple families.
The government remains legally bound to the commitments in the Child Poverty Act to a target of reducing child poverty to less than 10% in relative poverty and 5% in absolute poverty by 2020 (both before housing costs are factored in). These levels are currently 17% for the former (2.3 million children) and 19% for the latter (2.6 million children), before housing costs are taken into account.
The level of relative child poverty before housing costs is at the lowest recorded level since the 1980s, having remained stable since 2010/11.
The release also measures the percentage of children in combined low income and material deprivation, or in severe poverty (where household income is less than 50% of median income and the children are living in material deprivation). 13% of children were estimated to be living in low income and material deprivation (1.8 million children), and 4% in severe poverty (500,000 children). But we can't look at the long term trends compare these back any further than 2010/11 because of changes in the measure of material deprivation.
The Institute for Fiscal Studies has predicted that relative poverty will increase over the next few years - when changes to the way in which benefits are uprated (resulted in smaller annual increases) will be reflected in the statistics. It also told us that their model found that had the government not implemented the recent reforms to the tax and benefits system, poverty levels would have been lower than they are.
The government has estimated that the uprating measures in 2013-14 to 2015-16 will result in an extra 200,000 children being deemed as being in relative income poverty.
Merits to relative and absolute measures, shouldn't focus on one
The Institute for Fiscal Studies has said, in response to the government's consultation on measuring child poverty, that both measures are limited on their own:
"Relative measures do not reveal what has happened to absolute living standards and, as the consultation document repeatedly states, this can look particularly perverse during recessions (if considered in isolation from absolute measures). But absolute measures cannot reveal whether there is a group towards the bottom of the distribution falling further and further behind everyone else over time, which is also a perfectly legitimate concern.
They also suggest that annual changes in median income may not represent year on year changes in what people consider as 'poor'. So, it suggests the absolute measure may be more useful for year-to-year trends in poverty, while tracking relative measures may be more useful for longer-term comparisons.
Income isn't the only indicator of poverty
Research reports such as that by the Poverty and Social Exclusion in the United Kingdom (PSE) project compile a list of 'necessities' identified by the public as things that everyone should be able to afford. In their 2013 report, for adults, this included things like being able to afford heating to warm living areas of the home, having a damp-free home and having two meals a day. For children, having a warm winter coat, fresh fruit and vegetables once a day and new, properly fitting shoes were considered necessities.
It found, for example, 9% of households (2.3 million) couldn't afford to heat the living areas of their home in 2012. It also found 9% of children (1 million) went without one or more items of basic clothing such as a warm winter coat.
It also found that in Britain, the number of people who could not afford one or more essential household good (like a telephone, or washing machine) had increased from 6.5 million in 1990, to 8 million in 1999 and 12 million in 2012.
The Government has also consulted on a broader measure of child poverty, including things like poor housing, parental skills, unmanageable debt and family stability. It has not published a response yet.


