2 June's BBC Question Time, factchecked
On the Question Time panel last night were Conservative environment secretary Elizabeth Truss MP, Labour’s Frank Field MP, UKIP’s leader in the Welsh Assembly Neil Hamilton AM, Plaid Cymru’s Liz Saville-Roberts MP, and columnist Owen Jones.
We checked their claims on the scale of immigration, its impact on wages, the auditing of EU accounts, economists’ views of leaving the EU, and the government’s house building record.
Honesty in public debate matters
You can help us take action – and get our regular free email
Immigration figures
“The [immigration] figures are a third of a million. Over 250,000 actually from Europe.”—Frank Field MP
“ We’re adding to our population every single year, on the Government’s official figures, a third of a million people. So we’re adding a city the size of Cardiff to the population of the UK every single year.”—Neil Hamilton AM
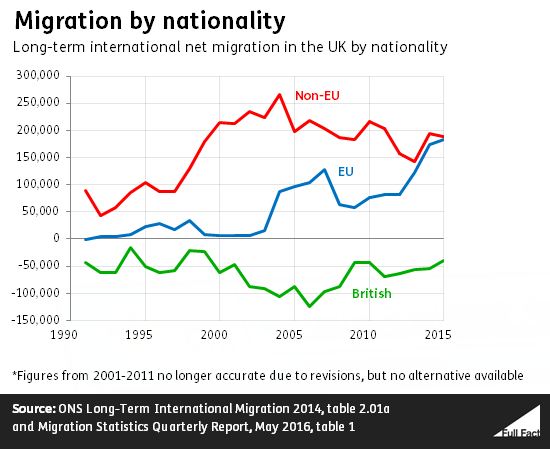
These figures are correct, but Mr Field is mixing two different sets of numbers together. Estimated EU immigration is less than half of total immigration.
Overall net migration—the difference between people coming to live in the UK and leaving to live abroad—is about a third of a million. So it includes people arriving and leaving. The 'over 250,000' figure just refers to the number of people arriving here from the EU.
In 2015, it was estimated that 270,000 citizens from other EU countries immigrated to the UK, and 85,000 emigrated abroad. So EU ‘net migration’ was around 185,000.
The total net migration to the UK in that year, including both those from the EU and non-EU citizens, was an estimated 333,000. That’s almost as many people as the population of Cardiff in 2014 (354,000).
There is a large margin for error in these migration figures, and they record only ‘long-term migration’. We’ve got more detail in this piece.
Immigration’s impact on wages
“We cannot cope with the scale and speed of current immigration [...] what greater attack could there be on workers’ rights than to depress wages on the lowest points on the income scale so that the minimum wage becomes the maximum wage for millions and millions of people.”—Neil Hamilton AM
It is difficult to measure the effect of immigration on wages with any certainty. That said, the evidence does suggest that it has a relatively small effect on average wages, and more significant impacts for low and high-wage workers. Low-wage workers lose and high-paid workers gain.
Some research has also found that workers already resident in the UK, who are immigrants themselves, are most likely to find their wages decrease as their skills more closely match those of arriving.
The effect of migration on wages often depends on the skills of the migrants coming to the UK and whether they complement or substitute the skills of the existing workforce.
Auditors sign off the EU budget
“I can’t remember the last time that your [voters’] money was accounted properly in Europe and was signed off by the auditors. They actually cannot justify how they’re spending your money.”—Frank Field MP
The European Court of Auditors—which checks the EU’s accounts—gives two different opinions on them each year: whether they’re accurate and reliable, and whether there’s evidence that money is being received or paid in error.
The Court regularly ‘signs off’ the reliability of the accounts, and has given them a clean bill of health for the last eight years. But it has consistently found significant errors in how the money is paid out since it began giving opinions in 1995.
So the numbers accurately reflect what actually happened, but some of the spending shouldn’t have happened in the first place. The largest proportion of these errors related to ineligible costs being included in claims for funding.
Although the 2014 accounts were signed off, the Court did find that 4.4% of EU spending was subject to error; just under £5 billion. The Court says: the figure is “not a measure of fraud, inefficiency or waste. It is an estimate of the money that should not have been paid out because it was not used in accordance with the applicable rules and regulations.”
The EU does recover some of this money, but this only affects the error rate if it is recovered before that year’s audit. Sometimes the process can take much longer.
The European Commission also says that member states control 80% of EU funds, with the remainder managed directly by the Commission. So “national governments are equally responsible for protecting the EU’s financial interests”.
Economists’ views on leaving the EU
“A lot of people today have been talking about the facts that have been bandied around. The reality is that 90% of the economists that are asked said that this [leaving the EU] would make Britain worse off.”—Elizabeth Truss MP
A recent poll by Ipsos Mori did find that 88% of economists responding to the survey thought the UK economy would be negatively affected if the UK left the EU and the single market. This was over the next five years. When asked about the next 10 to 20 years the figure dropped to 72%.
The most common reasons they gave for this were loss of access to the single market and uncertainty leading to reduced investment.
Ipsos Mori stresses that the survey “should only be taken as representative of those who responded”. It was only sent to 3,800 people who were members of the Royal Economic Society and the Society of Business Economists. Out of that 3,800, there were 639 responses—that’s 17% of all the people who were asked. The results weren’t weighted.
While it’s difficult to be very exact about the economic cost of leaving the EU, most economists think that there would be one. The Ipsos Mori survey echoes one by the Financial Times in which three-quarters of those asked thought that leaving the EU would reduce economic growth.
The Institute for Fiscal Studies has found that of eight major studies, only two identified a positive impact on the economy by 2030 if the UK voted to leave. But again the studies vary in the exact figures they give, partly because they cover a number of possible scenarios after leaving the EU.
Housing
“This Government’s house building record is the lowest now in peacetime in England and Wales” —Owen Jones
“The fact is that our Government, over the past five years, built more council houses than Labour did over their 13 years in office.”—Elizabeth Truss MP
We have seen claims like these many times before. Both only provide part of the picture.
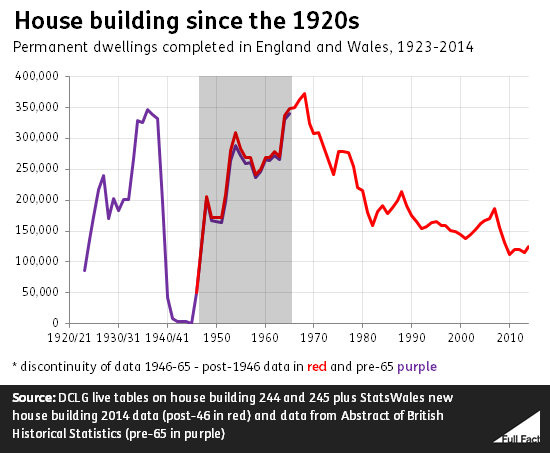
The claim that housebuilding is at a record peacetime low is correct, but there’s a bigger picture. In England and Wales, recent years have seen the fewest new homes completed per year during peacetime since the 1920s.
But, as our graph shows, the number of new homes has been falling since the 1960s.
 Liz Truss’ claim is also technically accurate. In the last Parliament, around 7,000 council homes were built for local authorities in England, compared to 2,900 between elections in 1997 and 2010.
But most social housing is built by housing associations these days, so only looking at council houses doesn’t reflect what’s actually going on with social housing. Overall, social housing providers built 129,000 homes under the five years of the last government, compared to 251,000 under 13 years of Labour.

“Five million people languish on social housing waiting lists.”—Owen Jones
We haven’t been able to work out how this figure has been calculated, as the social housing waiting list counts the number of applicants by households, not the number of individuals. There are currently 1.2 million households in England on the list.
Mr Jones directed us to several previous reports that have referenced the figure of five million. The government has also used it.
But the housing charity Shelter and the Department for Communities and Local Government both told us that there are no official figures for the number of individuals currently waiting for social housing. None of the experts we spoke to could suggest an alternative source to those official figures.
It’s possible that it was arrived at by taking the number of households on the waiting list in a previous year, then multiplying it by the average number of people in a household. In 2012, there were over 1.8 million households on social housing waiting lists, and the average national household had 2.3 people in it. That would produce a figure of 4.2 million people in England alone that year.
DCLG statisticians cautioned us against this approach, since families in social housing are likely to be smaller than the national average and there are likely to be large variations by area and region.
Alternatively the figure could refer to a prediction of future waiting list size by the Local Government Association back in 2008.
Update 17 June 2016
We've clarifed our analysis of Frank Field's claim on immigration, making the point that he's mixing two different sets of figures together.