"7 out of 10 Conservative MPs... represent constituencies that voted to leave, as did mine. 6 out of 10 Barry’s party [Labour] represent Leave constituencies."
Claire Perry MP, 12 July 2018
The results of the EU referendum weren’t counted by parliamentary constituency, so we don’t know for sure how constituencies voted. A small number of councils did release official breakdowns by parliamentary seat, and data on some other areas was obtained by the BBC via Freedom of Information requests.
The best figures we have for other constituencies comes from Professor Chris Hanretty, a political scientist at Royal Holloway University, who combined official results and the BBC data with statistical methods in order to estimate the proportion of Leave and Remain voters in every seat in England, Scotland and Wales.
These estimates show that while the national result of the referendum was relatively close, with 52% voting Leave and 48% voting Remain, a much larger majority of parliamentary seats voted to Leave – with 64% of seats in Great Britain voting Leave. (This is likely due to the uneven distribution of Remain voters, who tended to cluster in large cities, while Leave voters were more evenly spread.)
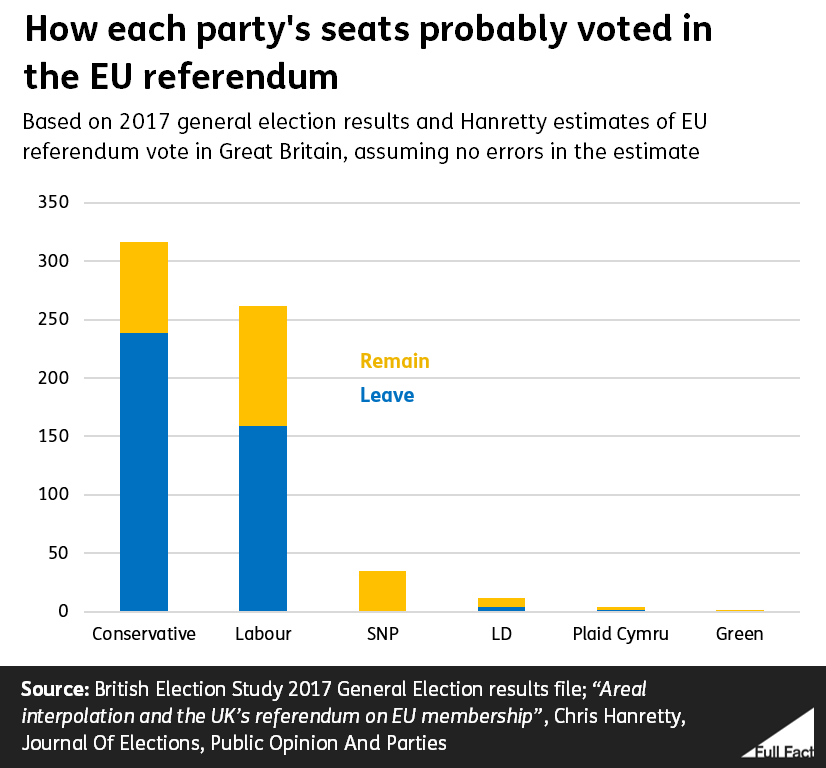
According to these estimates, around 75% of constituencies that were won by the Conservatives in the 2017 general election voted to Leave, while around 61% of Labour constituencies voted to Leave. All seats won by the Scottish National Party and the Green Party, and a majority of the seats won by the Liberal Democrats and Plaid Cymru, voted to Remain.
These estimates are most likely the ones being referred to when politicians discuss how constituencies voted. But other than the seats where the actual result is known for sure (only 20% of constituencies) they are just estimates.
As Professor Hanretty wrote when he released his work, “I’d like you to say ‘probably’ before you talk about how a constituency voted, unless I’ve flagged up a result as being known exactly.” The margin of error for the estimates is not known, due to the nature of the statistical methods used.
This means that for constituencies in which the exact results are unknown, and which the estimates suggest the result of the referendum vote was close, we can’t be certain about saying whether the constituency voted Leave or Remain.
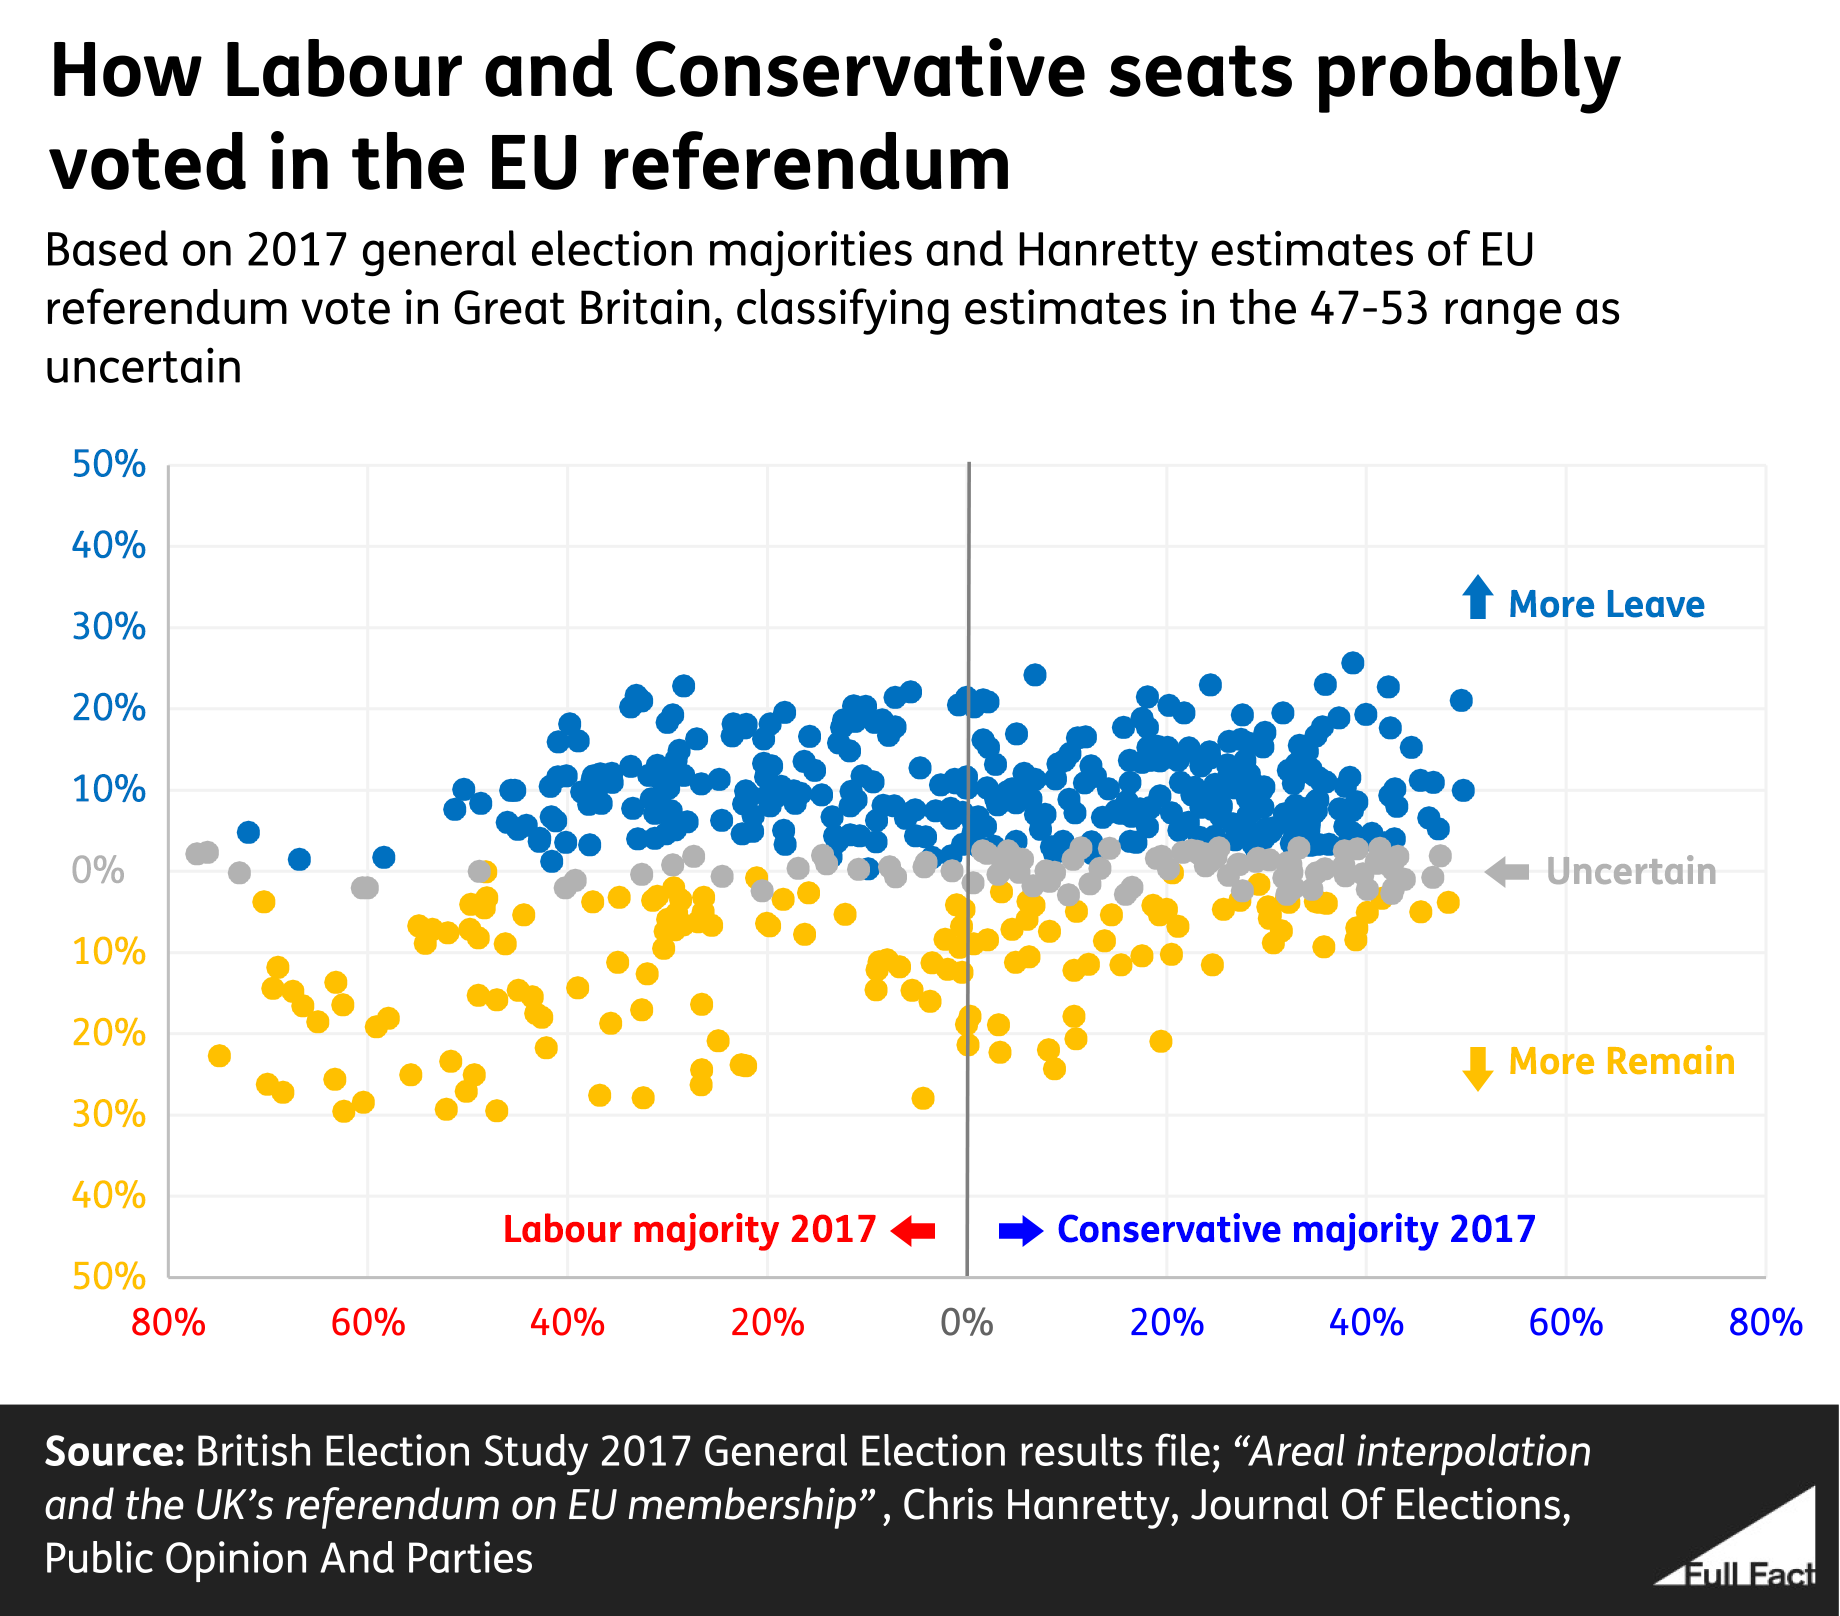
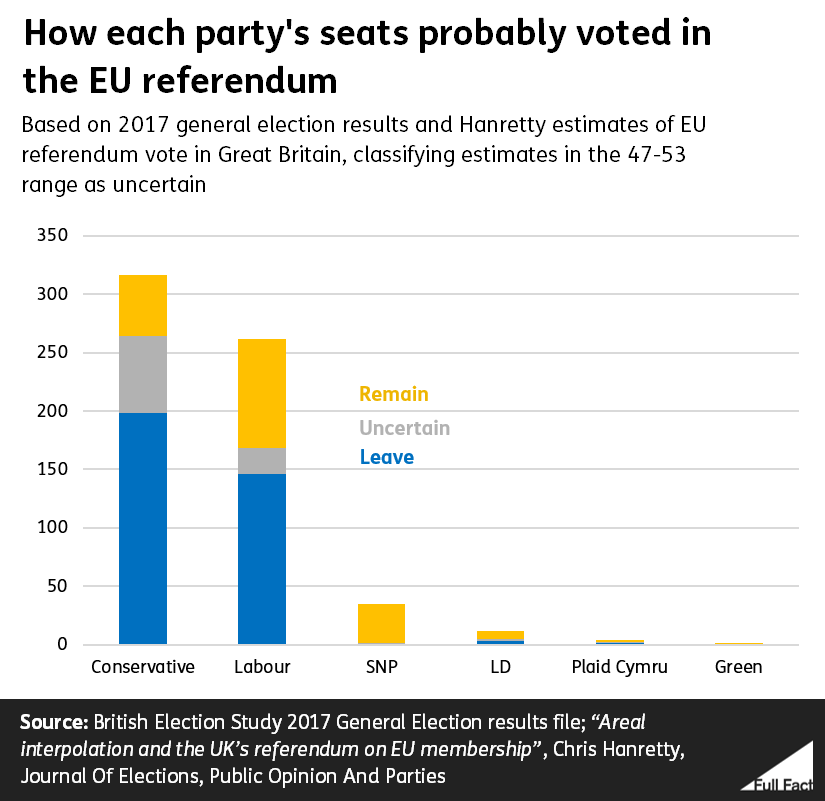
Looking just at seats held by the Conservatives and Labour, if we highlight seats where the estimated referendum vote was within the 47% to 53% range and the actual result isn’t known, we can see that there are a large number of seats where the referendum vote is still uncertain. When you factor in this uncertainty, the figures for how each party’s seats voted changes a bit. By this count, 62% of Conservative seats voted Leave, with 21% uncertain and 17% Remain. Labour’s seats, meanwhile, voted 56% Leave, 8% uncertain, and 36% Remain.
 Of course, this depends on how wide a range of estimates you choose to classify as being “uncertain”. In doing these calculations for results in the 47% to 53% range, we deliberately opted for a relatively cautious approach, informed by the observable errors in Professor Hanretty’s estimates when compared with known results – where the average error was 1.7% and only 16 out of 128 seats had an error greater than 3%.

 When you factor in this uncertainty, the figures for how each party’s seats voted changes a bit. By this count, 62% of Conservative seats voted Leave, with 21% uncertain and 17% Remain. Labour’s seats, meanwhile, voted 56% Leave, 8% uncertain, and 36% Remain.
 Of course, this depends on how wide a range of estimates you choose to classify as being “uncertain”. In doing these calculations for results in the 47% to 53% range, we deliberately opted for a relatively cautious approach, informed by the observable errors in Professor Hanretty’s estimates when compared with known results