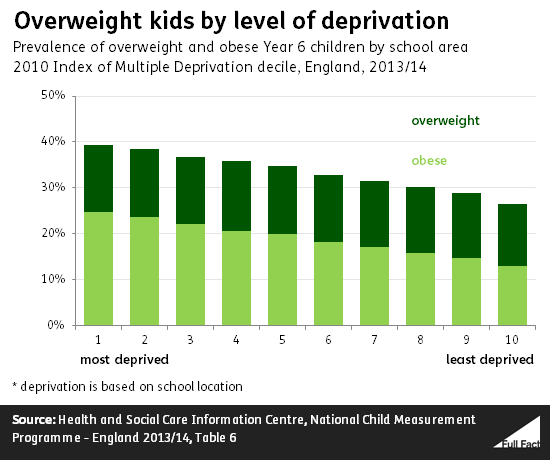
"What we know is that one in four of the most disadvantaged children are leaving primary school obese, not just overweight but obese, and that's twice the rate in the most advantaged children."
Sarah Wollaston MP, 30 November 2015
Parliament's Health Select Committee has called for a 20% tax on sugary drinks, among other things, to help tackle childhood obesity. Critics of the idea say it will be ineffective and will disproportionately affect the poor. This point was put to the Committee's chair Dr Sarah Wollaston, who said that the current situation already leads to worse health outcomes for the most disadvantaged children when compared to the best-off.
It's correct that 25% of the most deprived tenth of year 6 pupils are obese, almost double the 13% of the least deprived tenth. The proportions who are overweight are more similar, at 15% and 14% for the most deprived and least deprived respectively.

Deprivation here is being measured according to where the children's schools are located. So when we talk about "the most deprived tenth" we mean the 10% of children attending schools in the most deprived areas, rather than children living in poor households. That deprivation isn't necessarily all about income—it also factors in things like the employment opportunities and the level of crime in a particular area.
As for what we mean by by 'obese', it turns out to be quite complicated.
For adults the standard method is to plug height and weight into an equation to come out with a Body Mass Index (BMI) score, which then puts them into a particular band from underweight to obese. But this method doesn't work for children, whose healthy BMI scores change considerably according to their age and sex. So the BMI of a given child has to be further adjusted to account for this before children are put in a band.
In the UK the most commonly used way of doing that is a system called the "UK90", and this is what the figures we've used here are based on.
