Are A&E targets an accident waiting to happen?
"As winter bites, the NHS faces its toughest time of year, but there is mounting evidence that the Secretary of State has left it unprepared. For 105 of his 133 days in office, the Government have missed their own A&E target for major A&Es. Last week, for the first time, the figure fell below 90%.
"Right now in A&Es up and down England, ambulances are stuck in queues outside, patients are on trolleys in corridors, and people are waiting to be seen for hours on end. Does the Minister accept that there is a growing crisis in our A&Es, and if he does, what is he doing about it?"
Andy Burnham, Shadow Health Secretary, 15 January 2013
"The Right Honourable Gentleman is good at putting across figures based on brief snapshots in the year. We know that on an annual basis we are meeting the target, and that 96% of patients are being seen on time in A&Es...
"Let me make it clear to the Right Honourable Gentleman that it is wrong to try and distort figures based on outcomes from a snapshot of just a few days or a week. It is important to put across the clear picture, which is that the Government are meeting targets in the NHS and patients are being treated in a much more timely manner than under the previous Government."
Dr Dan Poulter, Health Minister, 15 January 2013
The issue
In 2011 the Coalition government began to introduce a series of indicators to gauge the performance of Accident and Emergency services across the NHS. The NHS Operational Framework for 2010/11 set the government's national 'standard' for A&E waiting times:
"The following indicator will now be subject to a 95% threshold: A four-hour maximum wait in A&E from arrival to admission, transfer or discharge"
This 'target' endures to the present day, as the same Framework for 2012/13 confirms:
"In judging performance nationally, we shall use the operational standard of 95% of patients being seen within four hours."
What exactly constitutes a 'waiting time'? Full Fact has explored this question before when the Shadow Health Secretary rightly highlighted that in some cases patients who are 'discharged' (the end of the waiting time) haven't necessarily been seen - they could have left of their own accord (although there are figures which record this as well).
The numbers
Waiting times for A&E departments are published on a weekly basis. The data shows the cumulative total patient 'attendances' and whether or not they were seen within set timeframes.
The latest data, for the week ending 6th January this year, confirms the Shadow Health Secretary's "snapshot" claims in the Commons. For that week, 93% of attendances (411,000 in total) clocked in at four hours or less.
But Mr Burnham wasn't talking about all A&E departments - just the major ones. At these units 89.6% of patients waited under four hours.
What makes a department 'major'? The NHS guidance notes on A&E statistics provide the answer. A major department [Type 1] has:
"A consultant-led 24 hour service with full resuscitation facilities and designated accommodation for the reception of accident and emergency patients".
Smaller kinds of A&E departments have different characteristics. Type 2 departments have specialities (dental, for example) and Type 3 departments are those that treat at least minor injuries and illnesses and can be routinely accessed without appointment.
The controversy
The Health Minister Dr Dan Poulter attacked Mr Burnham for trying to 'distort' figures by presenting an isolated "snapshot" of waiting times data. He even went so far as to accuse the Shadow Health Secretary of trying to mislead the House, before withdrawing the comment.
So are the figures being 'distorted'?
Full Fact confirmed with the relevant NHS statistics team that the weekly data does (as we might expect) highlight fluctuations on a week-to-week basis. This means that looking at one week's performance data in isolation might not give a full picture of the scale of the problem, so we might also want to look at corresponding periods (a similar period of the previous year) to check that this isn't a seasonal phenomenon (with waiting times influenced by wintry weather conditions, for example).
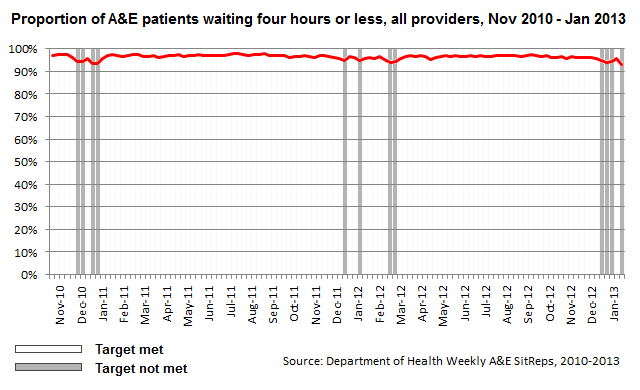
Bearing this in mind, we can chart the performance of A&E waiting times for all departments since November 2010 (from which point weekly data is available). These can be compared week-by-week against the 95% benchmark:

What's perhaps most striking is how little waiting times have, in reality, fluctuated on a weekly basis since the end of 2010. Waiting time targets are consistently met between 90-100% of the time and starting the graph from 0% demonstrates the trend is virtually a straight line.
Interestingly, however, all the occasions in which the week has slipped below the 95% benchmark have been in winter months - December 2010 and January 2011, the same months the following year and the same months again the year after. There is some drop off in performance at the very end of 2012, but this isn't unusual given 2010 and 2011 trends.
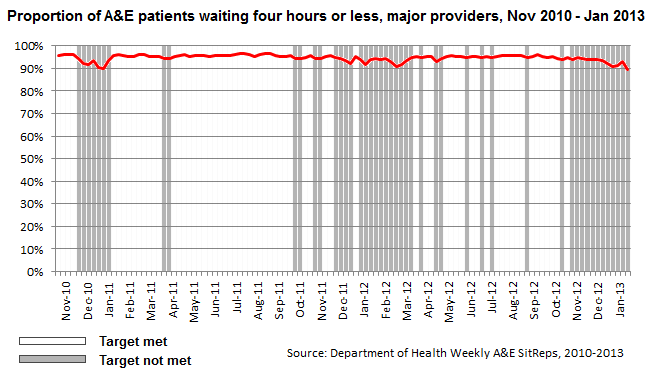
Take the same picture for only major A&E departments and the picture is very similar, except more consistently falling short of the 95% benchmark:

But we have to remember that the government's 95% standard doesn't specify what 'type' of A&E departments it's referring to, so strictly we should only hold them to the complete national picture. This doesn't mean we should ignore cases where standards are below the average, however, and it's clear that major departments struggle more to keep waiting times down.
That said, exactly the same (small but noticeable) seasonal trends are apparent. Performance has certainly fallen to its lowest level for major departments since November 2010, but this is a long way from an unprecedented dip, and not outside the bounds of what we might expect around this time of year.
Conclusion
It's easy to follow Andy Burnham's numbers from the latest statistics, but it's premature to jump to conclusions that NHS A&E services are failing more often.
We would be straining very hard to discern any meaningful trend in waiting time performance since 2010, and there's reason to expect slightly lower performance figures for winter months anyway.