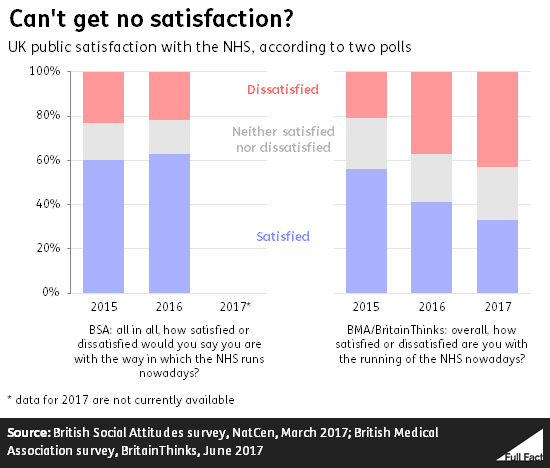
43% of the UK public are dissatisfied with the NHS compared with 33% who are satisfied, according to one survey commissioned by the British Medical Association (BMA).
The survey asked members of the public "overall, how satisfied or dissatisfied are you with the running of the NHS nowadays?". Responses were compared with similar surveys conducted in 2015 and 2016 and showed an increase in dissatisfaction from 21% to 43% between 2015 and 2017.
Other NHS satisfaction surveys are available
This isn’t the only survey asking the public their opinions on the NHS, though it does appear to be the only one conducted so far in 2017.
The British Social Attitudes (BSA) survey found that, in 2016, 63% were satisfied and 22% were dissatisfied. This survey asks a slightly different question - "all in all, how satisfied or dissatisfied would you say you are with the way in which the NHS runs nowadays?", which has been put to the public in almost every year since 1983.
In the past, the Department of Health has also commissioned a survey with a similar remit, though this was last conducted in 2014.
Why do they differ?
Although the BMA and BSA surveys provide roughly similar figures in 2015, there is a substantial difference between the surveys in 2016. This isn’t likely to be just by chance because each survey only has a narrow margin of error. Instead, differences in the methods used to gather this data may be responsible.
For example, the BSA survey asks about "the way in which the NHS runs", whereas the BMA survey asks about "the running of the NHS”. This subtle difference may affect what aspect of the NHS respondents are reflecting on, like frontline staff or the Department of Health.
Other factors such as survey timing (summer or winter) and interview format (online, phone, face-to-face) may also influence the results, but we can’t know for sure how much.
It is not uncommon for polling data to provide completely different results. In fact, we have discussed differences in NHS satisfaction surveys before.
Public versus patient satisfaction
The surveys discussed above gather views from the public rather than directly from patients. As has been noted by health experts at the Nuffield Trust, this means “we don’t know the extent to which actual patient experience is driving overall satisfaction relative to other variables including staff advocacy, media coverage, political affiliation and satisfaction with Government.”
To understand patients’ views about its services, NHS England produces a number of different surveys asking patients about their experiences. These include surveys for specific services like the GP Patient Survey, and also of the entire experience that patients with certain conditions have such as the Cancer Patient Experience Survey.
