Update 11/02/16: The Mirror has corrected its headline.
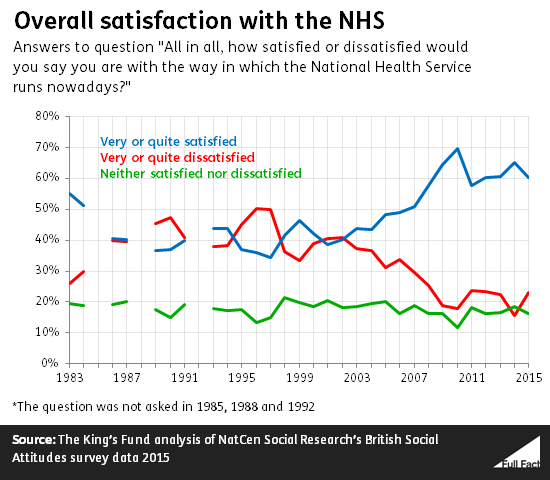
The Mirror’s headline is incorrect. The rise in dissatisfaction, according to new survey results, is the largest annual increase since this data started being collected in 1983. But the level of dissatisfaction has returned to roughly where it was between 2011 and 2013.
BBC News, the Telegraph and the Independent were among others to phrase this correctly.
We’ve asked for a correction from the Mirror.
The measure of satisfaction can reflect more than simply views on the quality of the NHS service. Researchers say that opinions are also influenced by things like politics and policy changes.
Satisfaction still high by historical standards
23% of people responding to the British Social Attitudes survey in 2015 said they were either very or quite dissatisfied with the way in which the NHS runs. That was up from 15% the previous year—a rise of eight percentage points, the highest annual rise since the survey began in 1983.
Dissatisfaction was last at this level in 2012.
Previously it has been much higher than this. It was once 50% in the mid-1990s.
More people said they were “quite dissatisfied” (16%) than “very dissatisfied” (7%).
By historical levels, satisfaction with the NHS remains high. Satisfaction was at the second-highest level ever recorded as recently as 2014.
The meaning of ‘satisfaction’
As a measure, "satisfaction" can capture more than simply people's views about the quality of the service, NatCen Social Research—which carries out the survey—said last year.
It pointed out that many of the people spoken to hadn't had recent experience of the NHS. So it's possible their satisfaction is based on an outside perception of the health service, perhaps influenced by politicians or the media.
Party political differences
Among people saying they were dissatisfied, the main reasons were waiting times for GP and hospital appointments (55%), insufficient staff numbers (44%) and under-funding (39%).
But this isn’t just about people’s experience of the NHS. Political affiliation also plays a part, for example.
The King’s Fund, a health charity which has analysed the data, said that there was a big difference in satisfaction between supporters of the Conservative and Labour parties.
While satisfaction among Conservative supporters remained about the same, satisfaction among Labour supporters fell back by 11 percentage points to its 2013 level of 59%.
The charity said this could reflect the general election result, as the survey was conducted in the few months afterwards.
Satisfaction among Labour supporters was particularly high the year before, which The King’s Fund commented is likely to be because “they were signalling a vote of support for the health service as an institution during tough times”.
It’s typical for satisfaction to be higher among supporters of the political party in power.
Among people saying they were satisfied, the biggest drivers were the quality of care provided (61%), the NHS being free at the point of use (59%) and the range of services and treatments available (54%).
