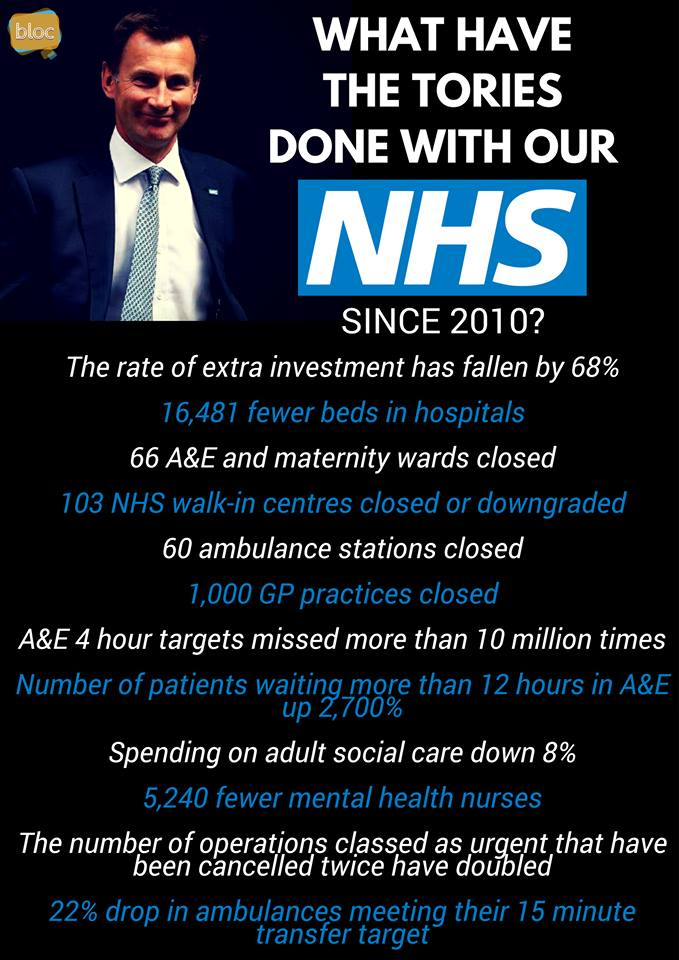
Some of our readers have asked us to factcheck this graphic on the NHS, which had been shared over 11,000 times on Facebook at the time of writing.
Unless otherwise stated this article relates to the NHS in England.
“The rate of extra investment has fallen by 68% [since 2010].”
- Correct, although this refers to UK health spending rather than just spending on the NHS.
- According to the Institute for Fiscal Studies (IFS), UK spending on health increased by 1.3% a year on average between 2009/10 and 2015/16, once you account for inflation. Between 1955/56 and 2015/16, this was 4.1% a year on average.
- That’s a fall in average spending growth of 68% in the period 2009/10 to 2015/16, compared to the average over the longer period.
- Using slightly different figures we can see that UK health spending rose by 6% a year on average in the seven years prior to 2009/10, and by 2% in the seven years from then onwards.
“16,481 fewer beds in hospitals [since 2010].”
- This is in the right ballpark, but doesn’t seem to be the best comparison. It seems to compare the number of beds at different times of the year and these numbers tend to change depending on the season. We’ve asked the creators of the graphic for more information.
- Using the latest figures, if you compare the same period (July to September) between 2010 and 2017, the number of beds available overnight in England decreased by around 13,200. The number of hospital beds has been generally falling for at least the last 30 years—although exact figures aren’t fully comparable over that time.
“66 A&E and maternity wards closed [since 2010].”
- The figures on how many accident and emergency units and maternity wards have closed aren’t published nationally.
- This claim seems to be based on an article in the Telegraph from 2014, which claimed 66 A&E and maternity units had been closed, downgraded, or there were plans to close or downgrade them since 2010. Rather confusingly the article lists over 70 A&Es or maternity units which were or might be affected.
- We’ve looked into the hospitals listed in the article and found that some A&Es and maternity units listed are still open. In around a quarter of cases we weren’t able to determine what had happened to the wards since 2010.
“103 NHS walk-in centres closed or downgraded [since 2010].”
- Figures on the number of walk-in centres that have closed are “not held centrally”.
- A review by Monitor, the then-sector regulator of health services, of walk-in centres in England published in 2014 found that of the 238 walk-in centres it estimated had originally opened, 51 had shut between 2010 and 2013. A third of these, the review found, were part of “reconfigurations to replace the walk-in centres with urgent care centres co-located with A&E departments at hospital sites, or with models that integrated primary care staff within an A&E department”.
- In January this year the campaign group 38 Degrees found that over 40 of the remaining walk-in centres have now also closed or been downgraded. We’ve seen its research and so far as we’re able to determine most of these walk-in centres have now closed or been downgraded.
- Walk-in centres treat a range of minor injuries and illnesses and patients can attend without an appointment.
“60 ambulance stations closed [since 2010].”
- This could be quoting an open letter from healthcare professionals published in the Guardian in 2015. We haven’t found a source for the original claim and figures on the number of ambulance stations aren’t regularly published.
- There were around 640 ambulance stations across England in 2015/16, according to the National Audit Office.
- The Valuation Office Agency (which advises the government on property) says that some ambulance trusts have adopted to a new structure involving a larger central station. It said: “Ambulance trusts adopting this system of provision have often sold off a significant number of existing ambulance stations which no longer fulfil an operational need.”
“1,000 GP practices closed [since 2010].”
- There are almost 1,000 fewer GP practices in England in 2017 than there were in 2010, but we don’t know exactly how many have closed in that time.
- Some of these practices may have closed completely, while others may have merged with neighbouring practices during this time, but the data doesn’t tell us how many—or if any new practices may have opened in the meantime.
“A&E 4 hour targets missed more than 10 million times [since 2010].”
- This is correct. Between 2010/11 and 2017/18, around 12 million A&E attendances in England took over four hours from arrival to admission, transfer or discharge.
- The number of attendances taking over four hours has been steadily increasing from over 350,000 in 2009/10 to 2.8 million in 2017/18.
- The NHS in England has a target to see 95% of attendances within four hours. In 2017/18 it saw around 88% within four hours of arrival.
“Number of patients waiting more than 12 hours in A&E up 2,700% [since 2010].”
- Correct (although not all of these patients will necessarily have waited in A&E). The number of patients who spent more than 12 hours waiting between the decision to admit them to hospital and their actual admission increased from 120 to almost 3,500 between 2011/12 and 2017/18 in England.
- Not all “emergency admissions” will be straight from A&E—some could be from other places, like a GP. Around a quarter of emergency hospital bed admissions were not via A&E in 2017/18.
“Spending on adult social care down 8% [since 2010].”
- Last year the IFS found councils’ spending on adult social care in England fell by 8% in real terms between 2009/10 and 2016/17.
- The population grew at the same time though so spending per person fell 13.5%.
- Newer analysis by the IFS puts the fall in spending between 2009/10 and 2016/17 at 6%. We’ve asked the IFS for more information about this figure.
- Councils in England pay for the social care services they provide from within their own budgets. The money councils have to spend on all the services and functions they provide comes from three main sources: council tax, business rates and money directly from the government. There is some money councils receive from the NHS and council tax which is specifically for adult social care.
“5,240 fewer mental health nurses [since 2010].”
- This isn’t comparing like with like. It’s comparing the number of full-time equivalent nurses working in mental health in the NHS in England between May 2010, and September 2017. But because some NHS staffing numbers change according to the season, this doesn’t give a fair picture of the change in staffing.
- If we compare the number of full-time equivalent mental health nurses between January 2010 and January 2018 (the latest figures), the drop is closer to 4,500.
- NHS Digital, who produce these figures, have a broader definition of mental health nurses which also includes nurses working in the field of learning difficulties. Using this definition of mental health nurses the number decreased by 6,700 over the same period.
- Full-time equivalent is the number of full time staff there would be if you added together all the hours worked to create full-time roles.
“The number of operations classed as urgent that have been cancelled twice have doubled [since 2010].”
- This is correct for urgent operations in England which have been cancelled by the NHS twice or more for a non-medical reason.
- In 2017/18, 154 urgent operations had been cancelled for the second time or more, compared to 66 in 2011/12 (the earliest full year we have figures for).
- The number of urgent operations cancelled for the first time has changed much less. There were around 3,500 in 2011/12 and 3,900 in 2017/18.
“22% drop in ambulances meeting their 15 minute transfer target [since 2010].”
- Not quite correct, the decrease between 2010/11 and 2015/16 was actually greater (28%).
- A National Audit Office analysis of ambulance services in England found 80% of patients’ transfers met the 15 minute target for transfer from an ambulance to emergency department in 2010/11. For 2015/16 they said 58% met the target.
- This is a 22 percentage point drop, not a 22% decrease.
- The NHS in England recommends that ambulances should hand their patient over to emergency departments within 15 minutes of arriving, and then be ready to be on the road again to respond to calls 15 minutes later.