NHS waiting lists: are the numbers of patients rising?
"300,000 more patients on NHS waiting list under coalition".
Guardian, 14 February 2014
It's often said that good things come to those who wait.
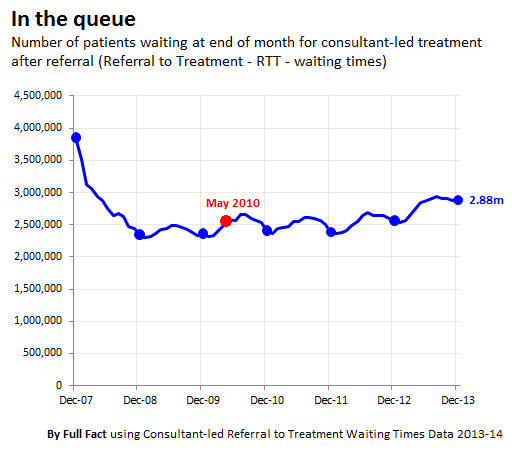
When it comes to NHS treatment, however, longer waiting lists are often seen as a bad sign. 2.88 million patients were waiting for 'consultant-led' NHS treatment at the end of last year; 300,000 more than there were around the time of the election, according to the Guardian.
The figures are right; but it's a false comparison. Seasonality in waiting times, caused by bank holidays and summer breaks, undermine any comparison between May 2010 and winter 2013. While a fair comparison of December to December shows the figures to be higher, improved data collection could be causing the rise and therefore it's difficult to draw conclusions.
Fluctuations in waiting lists in summer and autumn
'Consultant-led' treatment isn't just an everyday visit to a GP — it happens when a GP refers someone to a specialist for treatment, such as a gynaecologist or a dermatologist.
The time it takes between being referred by a GP, to being treated by a specialist, is the waiting time. Most people (about 94%) are seen within 18 weeks and - provided it's non-urgent - they have a right to be seen in this time.
But the number of people waiting for treatment at any one time fluctuates. Waiting lists tend to grow in summer and fall in the autumn — that's because bank holidays and summer breaks taken by both patients and staff tend to draw out the time it takes to get treatment. In autumn the rate tends to recover.
[caption id="attachment_29530" align="alignnone" width="512"] Waiting times - and why the time of year matters.[/caption]
So it doesn't make sense to compare May 2010 — just as the usual summer 'bulge' is about to kick in — with winter 2013. In fact, as a general rule this would even understate the size of the increase.
Comparing May 2010 with May 2013 (the most recent comparable month) shows that 270,000 more people are waiting. Conversely, comparing December 2010 with December 2013 shows 470,000 more waiting — much more than the Guardian mentions.
'Seasonality' aside, it's still clear there's been a rise in waiting lists.
But it's not necessarily an indication of Coalition 'failure' either.
That's because the quality of the measurement has changed as well. In 2012 the Coalition introduced a target that 92% of patients on 'incomplete pathways' (still waiting to start treatment) needed to be seen within 18 weeks. As NHS England concedes however:
"The announcement of the operational waiting time standard for incomplete pathways in November 2011 and its introduction from April 2012 is likely to have led to some hospital trusts improving data capture of incomplete RTT pathways.
"It is likely that this caused much of the increase in the RTT waiting list in 2012."
How much the measurement change has affected the trend isn't made clear, but it gives us some reason to doubt that the increase in waiting patients is actually as high as the numbers suggest.