Winter 2017/18: the worst ever for the NHS?
Was this the worst winter ever for the NHS in England? It's a question that has been asked a lot. We joined up with the independent health experts Nuffield Trust to find out.
It has been widely acknowledged that the winter of 2017/18 saw the NHS in England experience extreme—and possibly unprecedented—pressures. Health Secretary Jeremy Hunt himself admitted that the pressures on the system meant it “probably was the worst ever” winter for the health service, and NHS England Chief Executive Simon Stevens said at the Nuffield Trust health policy summit that February 2018 was probably the “most pressurised month the NHS has seen in its nearly 70 year history”.
The high profile cancellation of planned operations for the whole of January, the worst flu outbreak this decade, and the weekly digest of stories in national and local papers detailing overflowing A&E departments and ambulance services certainly gave the impression of the worst winter in recent years. But are these impressions borne out by the data?
To answer this we looked at the winter of 2017/18 through four different perspectives:
- Demand for emergency care
- Bed capacity within the NHS
- Waiting times for emergency care
- The NHS’s response to pressure
While the data doesn’t allow us to look back far enough to test whether this was the worst winter ever, we found that the NHS experienced extreme and possibly unprecedented demand. Despite this bed occupancy remained at the levels seen in previous years. This is likely to be down to longer waits to access hospital care and adopting new moves to free up beds.
This briefing focuses on winter pressures in hospitals, predominantly because there is no national level data to help us understand pressures on GPs, despite the fact that they see far more patients than hospitals.
Honesty in public debate matters
You can help us take action – and get our regular free email
Demand for emergency care
While ‘demand’ is a complex concept in healthcare, encompassing more than the numbers of patients needing care, looking at data on how many patients arrived at hospital by ambulance, attended A&E and experienced an emergency admission can give us a good start in assessing whether this winter was uniquely busy for ambulance trusts and A&E departments.
Roughly the same number of people arrived at hospital by ambulance last December to February as they did in the same months in previous winters – just over 1.2 million per year. However, A&E departments did see substantially more patients attending A&E—roughly 5.8 million in the winter months in 2017/18 compared to just under 5.6 million the year before, an increase of 5%.
Over the past five years, A&E attendances in the winter months grew by 13%.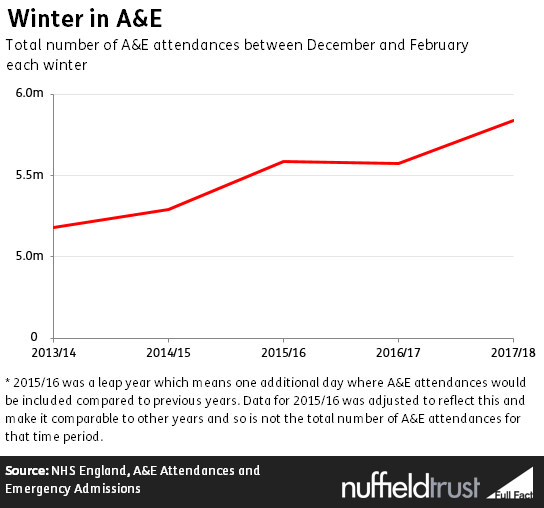
Bed capacity within the NHS
Given the increase in demand, we would expect more beds in NHS hospitals to have been occupied this winter. But the data suggests that was not the case.
On average there were slightly fewer beds occupied between 1 December and 28 February in 2017/18 (over 92,000 per day on average) compared to the same time period in 2015/16 (almost 95,000).
Bed capacity is also influenced by the beds closed due to diarrhoea and vomiting/norovirus like symptoms. This winter there were about 74,000 beds closed because of this—equivalent to approximately 1.2 hospitals being closed per day[1]. This was substantially more than 2016/17 when over 63,000 beds were closed, and over twice as many as in 2015/16 when nearly 35,000 beds were closed. This is despite there being comparable levels of laboratory reports of norovirus in England and Wales as in previous years by the end of February 2018.
But even with these extra closed beds, the bed occupancy levels—or the proportion of beds overall occupied overnight—was not significantly higher than the previous two winters. While the proportion of beds occupied in 2017/18 was very slightly higher than in the previous winter (94.4% on average per day compared to 93.8% in 2016/17), in 2015/16 it was higher still at 94.7%. This is despite the overall numbers of beds decreasing in recent years. There were around 93,600 core beds available per day in 2017/18.
So if overall bed numbers have been reduced and more beds have been closed due to diarrhoea and vomiting/norovirus like symptoms, while there is more demand, then how can bed occupancy levels have changed so little?
Waiting times for emergency care
One explanation is that people have been waiting longer to access hospital care—in ambulances before entering the hospital, at A&E departments, and on trolleys once the decision to admit them to hospital has been taken.
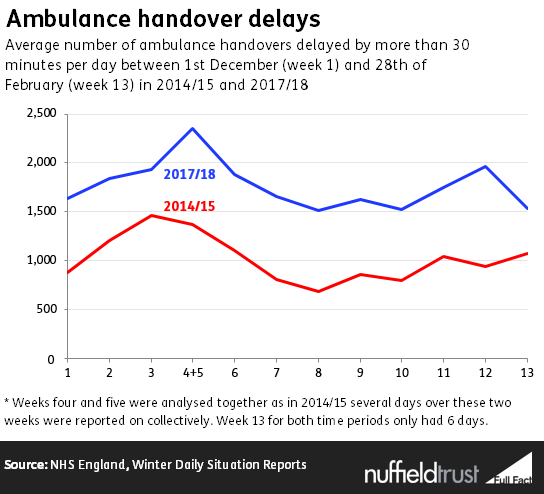
In the winter of 2017/18 over 163,000 ambulances were delayed in handing patients over to A&E by 30 minutes or more. This equates to on average of about 1,800 per day or 13% of all ambulances arriving during that time period.
These figures weren’t collected in the previous two winters, but the most recent comparable data[2] shows that this is a significant increase from 2014/15, when around 94,000[3] ambulances (or just over 1,000 per day on average) were delayed by 30 minutes or more. This is a continued increase on a trend that was already deteriorating prior to 2014/15.
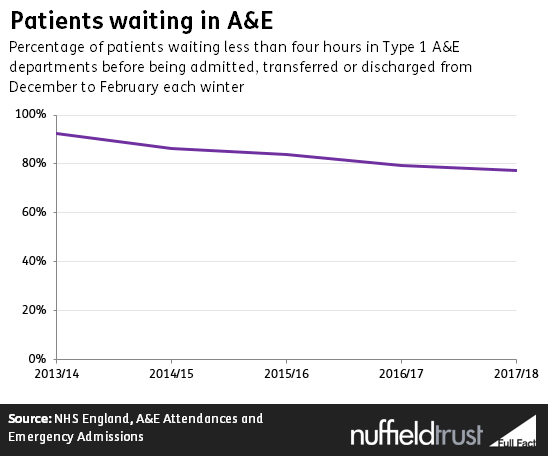
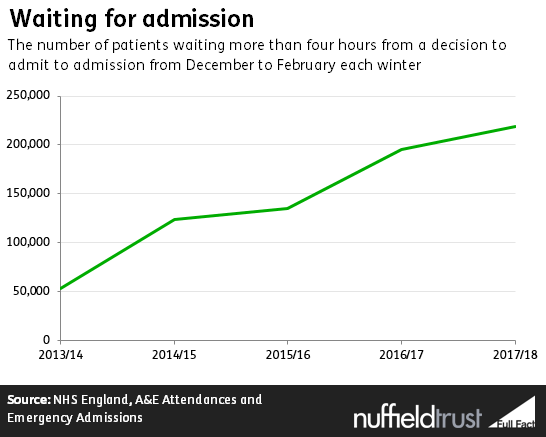
When the decision is made to admit a patient from A&E into hospital, the length of time they wait for a bed on a ward (often known as a ‘trolley wait’) has grown year on year. In winter 2013/14 one in 25 patients (4%) waited for more than four hours. This winter more than one in seven patients (14%) waited longer than four hours for a bed in hospital, a total of almost 219,000 patients.
Similarly, the number of those waiting an extremely long time for an admission has increased: there were over 13 times more patients waiting more than 12 hours in the winter of 2017/18 than there were in the winter of 2013/14.
 The NHS’s response to pressure
While the increases in patients waiting longer for hospital care offers a partial explanation as to how the NHS kept bed occupancy levels stable in 2017/18 despite increased pressures, it does not provide the whole picture. The NHS also took a number of deliberate steps to either increase the numbers of beds available to patients or restrict access to certain parts of the hospital.
Measures to increase the beds available
One way hospitals can increase bed stock is to open escalation beds. These are additional beds brought into service in order to accommodate extra patients. There were on average 3,908 escalation beds open every day of the winter of 2017/18—equivalent to opening an additional 5.7 hospital trusts[1] for that period. This was slightly higher than previous winters, with an average of 3,660 escalation beds open on any given day in 2016/17 and 3,479 in 2015/16.
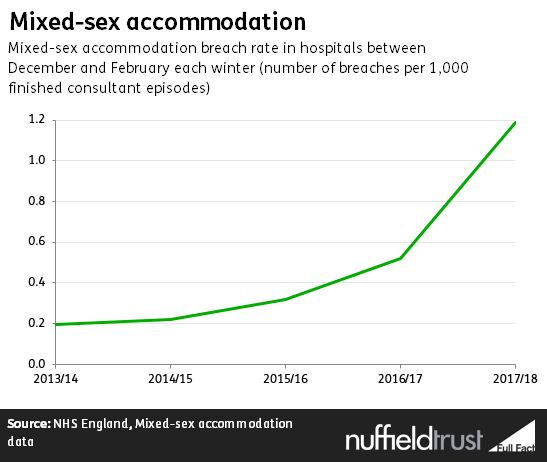
Another way to increase the available beds is to place patients on mixed sex wards. While two out of three trusts did not report any mixed sex accommodation breaches in February 2018, this winter saw more hospitals using mixed sex accommodation in an attempt to manage pressures than in previous winters. From December to February the breach rate was 1.19 per 1,000 single episodes of care, over twice the rate it was in 2016/17 and over six times more than the rate in 2013/14.
Measures to restrict activity
One of the most high profile ways in which the NHS managed demand for hospital care this winter was in cancelling planned operations for non-urgent procedures, which was intended both to free up beds and staff. This was announced before Christmas and extended in the New Year to include the whole of January, marking a significant departure from the previous winter, where cancellations were limited to the Christmas period.
The impact of these cancellations is not recorded in the routinely available data available from NHS England, which looks only at last-minute cancellations. However, NHS England have recently published information on their analysis of NHS activity data for the month of January, showing 23,000 fewer elective admissions to hospital in January 2018 compared to January 2017 (a 3% decrease). They also estimate that these deferred elective cases freed up the equivalent of 1,400 beds in January.
A further way that hospitals can manage demand is in deciding to divert ambulances to nearby A&E departments in extreme circumstances. There were 329 A&E diverts in total between December 2017 and February 2018, which is less than the 493 diverts that occurred during the same time period in 2016/17 but more than the 265 in 2015/16.
The worst winter ever?
The data we examined shows that in the winter of 2017/18 there was no change in numbers of people arriving at hospitals by ambulance compared to previous years, but A&E and hospital activity has increased. This meant that, of the five years reviewed, demand for emergency care was at its greatest in 2017/18. This follows a longstanding trend but may also be in part because of increased influenza-like illnesses being seen this year.
Despite this, hospitals managed to keep the percentage of beds occupied stable, at around 94%—still extremely high, but not significantly higher than in previous years. This is despite a large increase in beds closed to norovirus.
The reasons for this are likely to be complicated, but it’s plausible to assume that this demand was absorbed by: patients having to wait longer for care—effectively substituting hospital beds for beds in ambulances, at A&E and on trolleys waiting for admission; the NHS adopting different ways to free up beds—from putting patients on mixed-sex wards, to driving down delayed transfers of care; and postponing or diverting care elsewhere.
So while the data doesn’t permit us to look back far enough to test Jeremy Hunt’s statement that these pressures led to the worst winter ever for the health service, it seems that the NHS experienced extreme and possibly unprecedented demand and patients waited longer for treatment this winter, with no signs of this abating. But without the steps taken to free up beds and staff, this winter could have been even worse.
[1] Using an average of 683 core beds open per day per trust between the 20th of November 2017 and the 4th March 2018 from NHS England’s, Winter Daily Situation Reports
[2] This data wasn’t collected in 2016/17 or 2015/16
[3] In 2014/15 the data for the 27th and 28th of February and 1st of March were combined into a total number of ambulances delayed by 30 minutes or more over that time period. Therefore to make 2014/15 data relate just up to the 28th of February, and therefore comparable with the 2017/18 data, the daily average for the 27th of February to the 1st of March was calculated. This average was then used for the values of the 27th and 28th of February when calculating the total between the 1st of December 2014 and the 28th of February 2015.