What’s happened to migration since 2010?
“My personal view is, we need to continue to bring immigration down.”
Amber Rudd, 7 May 2017
“...the Conservatives have failed just as badly, for seven years reneging on their pledge to bring annual net migration down to the ‘tens of thousands.’”
UKIP Manifesto, 25 May 2017
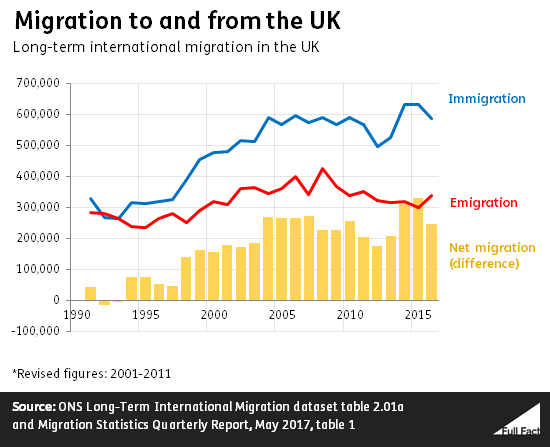
The latest figures show that net migration was estimated at 248,000 in 2016. That’s the difference between the number of people leaving the UK to live elsewhere and the number arriving to live here.
The number of people arriving was estimated at 588,000, while the number of people leaving was 339,000.
Honesty in public debate matters
You can help us take action – and get our regular free email
What has happened to net migration?
It’s actually difficult to be precise: migration figures between 2001 and 2011 are known to have underestimated the number of people coming here. We have new estimates for what net migration might actually have been during those years, but as ever the figures are uncertain.
The figures suggest net migration was around 244,000 in the 12 months to June 2010, during which the Coalition government entered office. So it’s about the same now.

Net migration is estimated to have fallen by 84,000 in 2016 compared to 2015.
This fall in net migration was largely down to more people leaving the UK, mainly EU citizens. Fewer people came to the UK in 2016 than the year before, but because of the way the figures are collected it’s not a big enough fall for us to be confident it’s genuine.
The net migration target has been consistently missed
The government has said that it wants to reduce annual net migration—the difference between the number of people coming to live in the UK and the number leaving in a given year—to tens of thousands a year.
It hasn’t been met. The Coalition government's own impact assessments as far back as 2011 suggested as much shortly after the target was introduced following the 2010 election.
Net migration has been estimated higher than 100,000 in every year since 1998.
What’s been done to reduce net migration?
EU nationals have the right to come and live and work in the UK at the moment, so past policies have been aimed at curbing the levels of immigration from outside the EU.
The Migration Observatory at Oxford University has identified a number of key policies that have been put in place to achieve this. This includes income caps for some skilled workers from non-EU countries or for British and non-EU nationals who want to bring a spouse who is not an EU national into the country. It also includes a cap on the number of skilled workers from non-EU countries coming to live in the UK and getting rid of the Tier 1 general visa.
But the Migration Observatory also concludes that “the measures introduced to reduce non-EU net migration have not succeeded in reducing it significantly”.
We don’t know what will happen after the UK leaves the EU, but the Migration Observatory has said that even if immigration from the EU to the UK was significantly reduced following Brexit, it is still likely to be far above the “tens of thousands” target.
EU net migration is estimated to have decreased to about 133,000. Non-EU net migration is estimated to have increased to 175,000, although once again we can’t be sure this increase isn’t down to the way the figures are collected. We’ve written more about what’s been happening to EU migration here.
How is migration measured?
The migration figures used here are collected by interviewing people leaving and arriving in the UK at airports, ferry terminals and other routes in and out of the UK. Broadly speaking, if someone plans to come and live in the UK for more than a year they are counted as an immigrant, if they plan to live outside the UK for more than a year, they are counted as an emigrant.
From these interviews the Office for National Statistics estimates the level of immigration and emigration to and from the UK, but the figures have a wide margin of error. The ONS says that the latest net migration figures from 2016 could be 41,000 higher or lower than the headline figure reported, 19 times out of 20.