Has cycling got safer under Boris Johnson?
"If you look at all the [cyclist] casualties on London's roads, that's actually gone up."
Jenny Jones, London Assembly Mayor's Question Time, 14 March 2012
"The number of casualties per cycle trip overall in London has been coming down in spite of the very considerable increase in cycling."
Boris Johnson, London Assembly Mayor's Question Time, 14 March 2012
London Assembly members were treated to a heated exchange between Green Party mayoral candidate Jenny Jones and the current incumbent Boris Johnson over cycle safety earlier this year.
In one of a series of clashes over transport between the pair in the run up to the 2012 election, Jenny Jones challenged Boris' record on cycle safety by claiming that the proportion of casualties per cycle trip has worsened over the last four years.
Boris then countered by saying that the cycling casualty rate overall in London is in fact in decline.
So, are cyclists any safer on the capital's streets under Boris than before?
Analysis
The dispute between the two candidates came to a head on 14 December last year, when Jenny Jones asked, in Assembly Questions to the Mayor:
"You have repeatedly said that "cycling is becoming safer in London", but have not always made clear whether this is in absolute terms or in terms of the ratio of cycle injuries to journeys..."
Boris Johnson then provided this table on cycle casualties from 2000 to 2010:
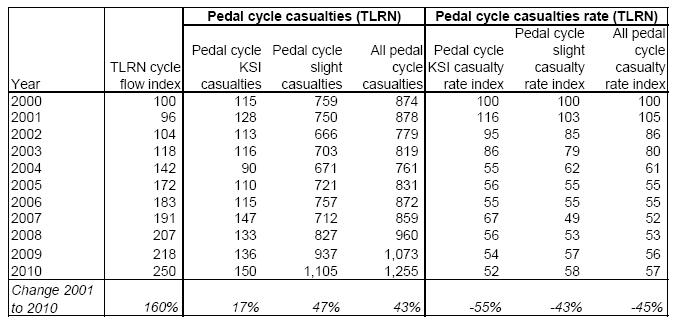
The cycle flow index uses the number of cycle journeys made. TLRN in the table refers to the 'Transport for London (TfL) road network', which instantly brings up complications. Not all roads in London are owned and maintainted by Transport for London. According to TfL, only five per cent of London's roads are part of the TLRN, although they do account for one third of the city's traffic.
Nevertheless, looking at the data provided by the Mayor, the number of cycle casualties on the TLRN has inceased since 2008. However this is in 'absolute' terms - a point raised by Jenny Jones in her question. The cycle flow on the TLRN has also increased.
So, looking at the actual casualty rate - the number killed and serious injuries (KSI) as a proportion of journeys made by bike - reveals that it has been in decline since 2008. The rate of casualties overall - including slight casualties - has however increased.
But given that this data applies to only five per cent of London's roads, it is worth examining the bigger picture.
TfL collects annual casualty data for Greater London which collates figures for slight, serious and fatal accidents each year. They compile the historical figures going back to 1986:
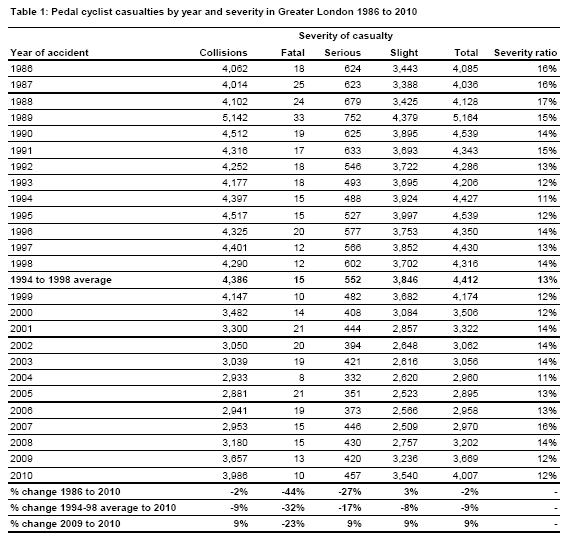
Across Greater London as a whole, the total number of casualties is greater than those provided by the Mayor showing only the TLRN. Again, the total number of casualties has gone up, although fatalities have decreased. Given the small numbers of fatalities, we can't judge very much from the recent changes.
However these figures too need to be looked at in the context of increased cycle journeys. The Green Party pointed Full Fact to TfL's 4th Travel in London Report to get a breakdown of the number of cycle journeys and trips estimated in each year.
TfL define "trips" differently to "journeys":
"A Trip is a complete door-to-door movement by an individual to achieve a specific purpose (eg to go from home to work).
"A Journey Stage is a part of a trip made on a specific mode of transport, eg a trip of 3 stages comprising a walk stage from home to a bus stop, a bus stage to central London, and a further walk stage to a place of work."
According to the TfL report, in 2010 there were 490,000 cycle trips per day and 540,000 journey stages per day. TfL provided Full Fact with detailed breakdowns of these numbers since 2000:
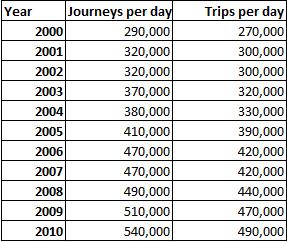
Full Fact took this data and compared it to the casualty figures published by TfL to calculate the annual rate of casualties based on cycle journeys and cycle trips. Using the journeys per day as the measure of cycle flow, we can estimate the casualty rates per 100,000 journey stages for total casualties and those involving only serious injury or death:
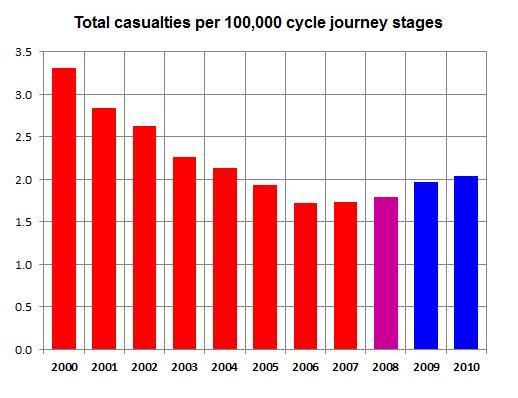
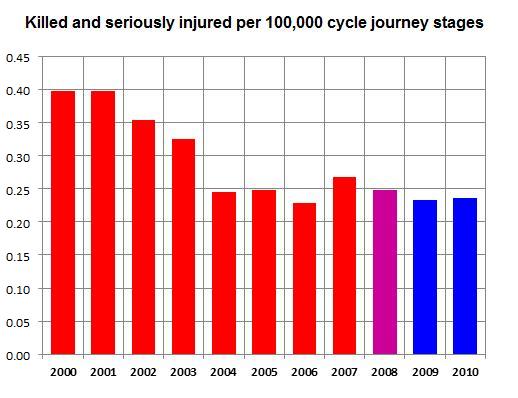
From this, we can see that the cycle casualty rate on London's roads has slightly increased for all casualties and remained broadly constant for fatalities and serious injuries since Boris arrived in City Hall.
It should be noted that these measures are far from perfect.
Measuring cycle flow by journeys - the method used by TfL and Full Fact using TfL's data, does not take into account actual miles travelled, so the measures used are only general indicators of how cycle use has increased over the years.
In addition, the data regarding 'serious' and 'slight' injuries need to be scrutinised. Both are based on police reporting, which may have been subject to changes in the way that it is gathered over the period.
Finally, it is not clear how many of the changes in cycle safety are attributable to Boris Johnson's impact as Mayor, particularly given the two different networks of road.
The Mayor only has direct responsibility for the TLRN, although may exert an indirect influence over the rest of London's roads, which are maintained by individual borough councils.
Conclusion
There are all sorts of different measures avaiable to assess cycle safety on London's roads. By the ones TfL provide, the absolute number of casualties is certainly increasing, although so is the number of cycle trips and journeys.
Looking at the cycle casualty rate, on the Transport for London Road Network, serious injuries and fatalities are coming down slightly, but total casualties are rising slightly.
Meanwhile, across Greater London as a whole, serious injuries and fatailities are fairly constant, while total casualties are again rising slightly.
During the debate, Boris admitted that his record is "not as good as I'd like it to be". At the very least, Jenny Jones would be correct in saying that, by the figures from TfL, cycle safety is not exactly one of wholesale improvement.
UPDATE (16/04/2012)
One of our readers has pointed us to figures compiled by the Department for Transport which chart cycle safety by miles travelled rather than just by number of journey stages.
These figures also show the total casualty rate in London has increased since 2008, and the Killed and Seriously Injured rate has increased marginally in the same period.