“The internal market that was originally created by the Conservatives, I think back in the late 1980s is currently costing in the order of £10 billion a year.”
Chris Williamson MP, 25 January 2018
This claim has been circulating for years, and there’s no good evidence we’ve seen that supports it.
None of the research that has been used to reach this figure actually tries to estimate the cost of the ‘internal market’ in England that was introduced to the NHS in 1991.
The figures behind it are estimates of the changing cost of administration to the NHS in England. The sources of those figures are either untraceable, subject to a lot of uncertainty, or no longer relevant to the way the NHS works today.
We don’t know the answer to this question, whether it turns out to be £10 billion or something very different.
Honesty in public debate matters
You can help us take action – and get our regular free email
The NHS ‘internal market’ was introduced in the early 1990s
The National Health Service and Community Care Act 1990 first introduced the 'internal market'. This meant the parts of the NHS that pay for care were divided from the parts that provide it (the purchaser/provider split).
Before that “providers, usually hospital doctors, had largely determined what services would be provided”.
In the 1990s, for the first time health authorities and some GPs could decide who to buy care from, creating competition between providers. This could be purchased from other NHS organisations, private companies or charities.
There have been other changes since then. The introduction of 'free choice' of provider for patients in 2008 and one of the focuses of the Health and Social Care Act in 2012 was increasing the choice of, and competition between, potential providers of healthcare.
A claim long on history but short on sources
Claims about the cost of the internal market tend to focus on comparing NHS admin costs before and after the early 1990s, although not everyone who makes the claim uses the same numbers.
Generally, the pattern goes like this: People claim administration costs on the NHS were about 5-6% of its budget before the 1990s, about 12% in the mid to late 1990s, 14% in the early 2000s, and speculate the proportion has grown even more since then.
The figures then get applied to the size of the NHS budget today, or recently, to calculate how much ‘more’ the NHS is paying each year. Most of those answers come in at around £10 billion.
None of the sources for any of the figures are easy to find, and in some cases they’re virtually impossible to pinpoint.
We went back and tried to find where these figures originally came from.
Estimates around 5-6% are hard to pinpoint
Mr Williamson’s office confirmed to us his source was a quote from Dr Jacky Davis in 2014, which we factchecked at the time. She used a figure of 6% pre-1990s and compared it to 15% as of 2013 and arrived at around £10 billion as an answer.
Figures of 5% and 6% pre-1990s have been widely quoted, but those instances rarely point to a primary source. According to Dr Charles Webster in 2002, who worked as the official historian of the NHS:
“In all international comparisons the NHS has traditionally scored highly on account of its low cost of administration, which until the 1980s amounted to about 5 per cent of health-service expenditure. After 1981 administrative costs soared: in 1997 they stood at about 12 per cent”.
Even if we accept this figure, we don’t know what it means exactly. There are a lot of different things you could include when counting admin costs on the NHS.
Some estimates include staffing costs as well as legal costs and office supplies
A 1995 study by NHS campaigners also took this 6% figure, and calculated their own updated version to compare it to. They claimed that by 1993 admin costs had doubled to about 12%.

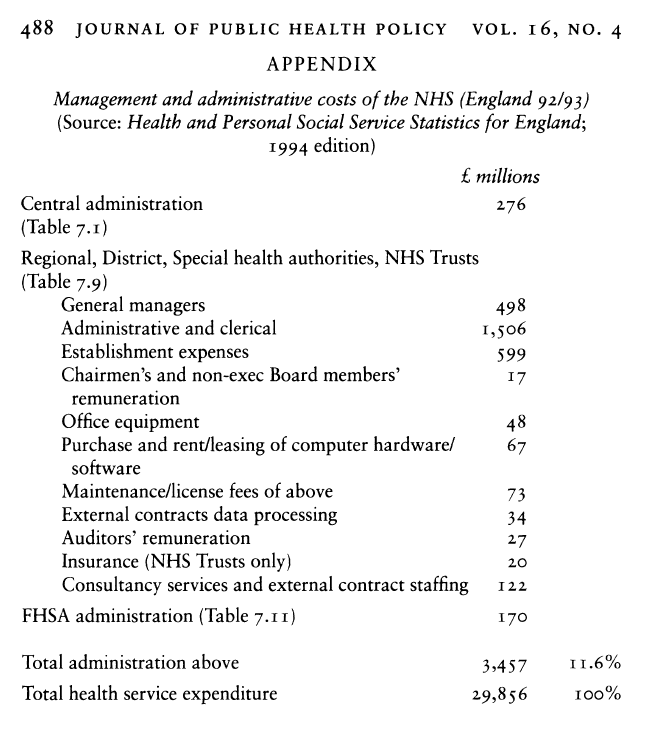
This actually has a proper source, albeit an obscure one. The Department of Health’s annual statistics publication for England in 1994 showed that if you add up things like staff salary costs, legal costs and office supplies, you can arrive at a figure of 12% of the total budget spent on admin costs.

But without knowing more about the older figures, we’ve no reason to trust that this is comparing like-with-like. Definitions of admin costs can vary a lot, and different studies look at different combinations of costs like the salary costs of managers, and clerical support workers, or including things like office supplies.
Even with the uncertainties spelled out above, it’s clear that the early 1990s was no ordinary period for the NHS.
It’s very obvious from the 1994 statistics that in the early 1990s, the NHS underwent a significant transformation. The number of managers, administrative and clerical staff surged between 1988 and 1992, as did the amount spent on managers’ salaries and executives’ remuneration.
These increases were thought to be “driven by the need to negotiate and monitor contracts between purchasers and providers”.
So it’s almost certain that the internal market, as one of the biggest reforms to the structure of the NHS at the time, had a role in the changes in staff and so changes in costs associated with that. The trouble is saying how much exactly, and accounting for the savings this new structure could have brought about elsewhere.
Estimates for the mid-2000s focused on admin staffing costs
The figure of 14% in the 2000s comes from a study, commissioned by the Department of Health at the time, which is unpublished. The authors told us that this was in part because it was a short-term project and was never peer-reviewed, but they provided us with a copy.
It did indeed estimate the costs were 13.5% of the health budget, based on estimating the salaries of managers and administrators in the NHS. But it also cautioned that these findings were uncertain, saying: “Our preliminary estimate should be regarded as no more than an initial guide and should only be used as such.”
The same study also warned against considering management costs in isolation. These can also contribute towards the performance and efficiency of the health care system, according to the researchers.
Even without these extensive cautions, we know that the 13.5% isn’t comparable to some of the earlier figures that have been quoted, because this is just a measure of salary costs rather than going into other aspects of the administration budget. We also know the study never intended to measure the specific effect of the ‘internal market’.
These aren’t estimates of the cost of the internal market
Whether or not these figures are robust or comparable is academic here—none of them can tell us what the internal market has cost the NHS.
A lot has changed about the NHS since the 1990s. The use of information technology has transformed, there’s more regulation, more targets for waiting times and more specialisation in the roles of clinicians and managers. These will all have increased admin costs, and a lot of it would have happened with or without the 1990s reforms introducing the internal market. Some researchers have tried to take some of these costs into account, reducing the overall cost estimate.
There’s also nothing in these figures that considers possible financial benefits of an internal market that offset the costs, such as resources being used more efficiently—this has also been the subject of debate.
To find out the role of the internal market in all of this, we’d need to estimate what the NHS would be spending today if the reforms had never happened, and compare this to what’s actually being spent. This would still give very uncertain results, but would be the only way to answer the question. We’ve seen no evidence that such a study has been undertaken.
If you know of useful research in this area we should take a look at, please get in touch.

